
Fig. 6
- ID
- ZDB-FIG-170609-41
- Publication
- Theodore et al., 2017 - Distinct Roles for Matrix Metalloproteinases 2 and 9 in Embryonic Hematopoietic Stem Cell Emergence, Migration, and Niche Colonization
- Other Figures
- All Figure Page
- Back to All Figure Page
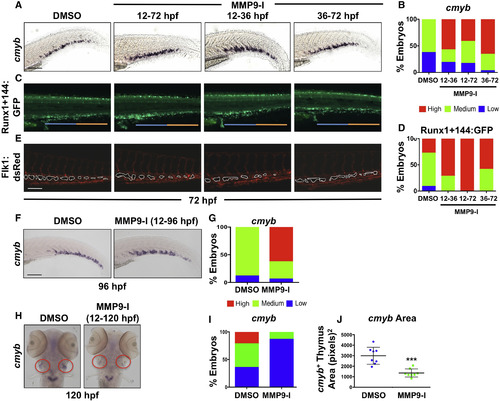
Mmp9 Inhibition Alters the Structure and Colonization of the CHT Niche (A) MMP9-I treatment during discrete intervals (12–72, 12–36, or 36–72 hpf) each increased CHT cmyb expression at 72 hpf by WISH compared with controls. (B) Qualitative phenotypic distribution of embryos from (A) scored with low, medium, or high cmyb expression in the CHT (n ≥ 20/condition). (C) MMP9-I exposure from 12–72, 12–36, or 36–72 hpf increased appearance of Runx1+144:GFP+ cells in the CHT; early treatment (12 hpf+) favored seeding of the anterior half of the CHT (blue bar) compared with the posterior (orange bar). (D) Qualitative phenotypic distribution of embryos from (C) scored with low, medium, or high overall Runx1+144:GFP expression in the CHT at 72 hpf (n ≥ 20/condition). (E) In vivo imaging of Flk1:dsRed+ showed hypovascularization of the CHT after early-onset (12 hpf+) MMP9-I exposure (n ≥ 10/condition), but not with late initiation. (F) MMP9-I treatment (12–96 hpf) retains cmyb+ HSPCs in the CHT (n ≥ 20/condition). (G) Qualitative phenotypic distribution of embryos from (F) scored for cmyb expression in the CHT at 96 hpf (n value and scoring as in A). (H) MMP9-I exposure (12–120 hpf) diminishes cmyb+ HSPC seeding the thymus (n ≥ 20/condition). Circles (red) highlight paired thymii. (I) Qualitative phenotypic distribution of embryos from (H) scored for cmyb expression in the thymus at 120 hpf (n value and scoring as in A). (J) ImageJ analysis showed significant decrease in cmyb+ thymic area after MMP9-I exposure (12–120 hpf; ∗∗∗p < 0.001). Error bars denote mean ± SD. Scale bars, 100 μm. |
| Genes: | |
|---|---|
| Fish: | |
| Condition: | |
| Anatomical Terms: | |
| Stage Range: | Protruding-mouth to Day 5 |
| Fish: | |
|---|---|
| Condition: | |
| Observed In: | |
| Stage Range: | Protruding-mouth to Day 5 |