
Fig. S2
- ID
- ZDB-FIG-170609-44
- Publication
- Theodore et al., 2017 - Distinct Roles for Matrix Metalloproteinases 2 and 9 in Embryonic Hematopoietic Stem Cell Emergence, Migration, and Niche Colonization
- Other Figures
- All Figure Page
- Back to All Figure Page
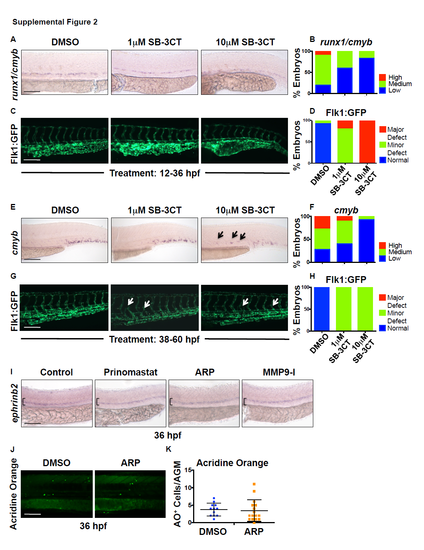
The pan-gelatinase inhibitor SB-3CT is toxic during early hematopoiesis, but ARPmediated Mmp2 inhibition has no effect on arterial identity or cell death. Related to Figure 2. A) Exposure to 10μM SB-3CT (pan-MMP2/9 inhibitor) during HSPC formation (12-36 hpf) decreased runx1/cmyb expression, while 1μM SB-3CT had no effect by WISH analysis. B) Qualitative phenotypic distribution of embryos scored with high/medium/low runx1/cmyb expression in the AGM at 36 hpf (n≥20 embryos/condition). C) High dose SB-3CT (10μM) treatment (as in S2A) caused major vascular defects and deformities in Tg(kdrl:gfp) embryos, suggestive of overall toxicity. D) Qualitative phenotypic distribution of embryos scored with normal/mild defect/major defect in Flk1:GFP expression (n≥20 embryos/condition). E) Exposure to high dose SB-3CT (10μM) at a later time point (38-60 hpf), post-HSPC specification and EHT onset, diminished cmyb expression in the CHT and caused sustained appearance in the AGM, while low dose (1μM) had less prominent impact by WISH analysis. F) Qualitative phenotypic distribution of embryos scored with high/medium/low cmyb expression in the CHT at 60 hpf (n-value as in 2B). G) Delayed onset of treatment with SB-3CT (as in S2E) led to minor vascular defects (abnormal vascular branching) in Tg(kdrl:gfp) embryos, suggesting embryos better tolerate exposure at later time points. H) Qualitative phenotypic distribution of embryos scored with normal/mild defect/major defect in Flk1:GFP expression (n-value as in 2D). I) Exposure to Prinomastat (20μM), ARP-101 (ARP, 10μM), or MMP9-I (5μM) during HSPC formation (12-36 hpf) had no effect on ephrinB2 expression in the AGM at 36 hpf by WISH analysis (n≥10/condition). J) Exposure to ARP does not alter the appearance of Acridine Orange (AO) positive (apoptotic) cells in the AGM at 36 hpf compared to controls. K) Quantification of the number of AO+ cells in the AGM region in control and ARP treated embryos (DMSO: 3.64 ±2.90; ARP: 3.25 ±2.59; p=0.61, 2-tailed t-test; n≥20 embryos/condition). Scale bars: 100μm. |