
Fig. 4
- ID
- ZDB-FIG-170222-52
- Publication
- Akbalik et al., 2017 - Visualization of newly synthesized neuronal RNA in vitro and in vivo using click-chemistry
- Other Figures
- All Figure Page
- Back to All Figure Page
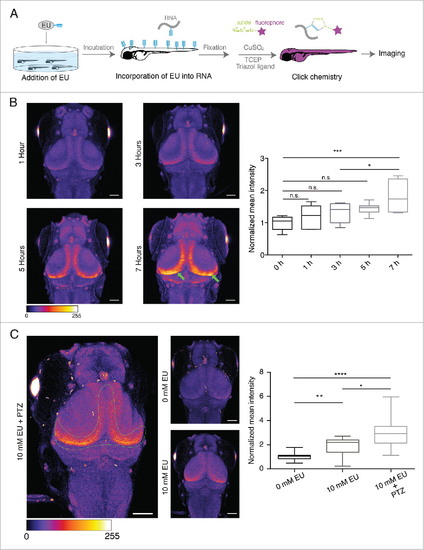
In vivo labeling of newly synthesized RNA in the larval zebrafish brain. (A) Experimental procedure. (B) Left. Representative images of the larval zebrafish head (dorsal view) showing the time-dependent increase in nascent RNA signal in specific regions (green arrows) of the tectum. LUT, Fire (pixel intensities 0–255). Right. Graph representing the time-dependent increase in the normalized mean fluorescence intensity of RNA signal for the indicated conditions. Scale bar, 25 μm. n = 7–9 larvae from 2 independent experiments. *p = 0.0221, p = 0.0001, n.s., (not significant). LUT, Fire. (C) Left. Representative images of the larval zebrafish head (dorsal view) showing PTZ-induced increase in the newly synthesized RNA signal in the indicated region of the tectum. Scale bar, 25 μm. LUT, Fire (pixel intensities 0–255). Right. Graph representing the PTZ- induced increase in the normalized mean intensity of the newly synthesized RNA signal for the indicated conditions. n = 22–24 larvae from 4 independent experiments. *p = 0.0133, **p = 0.0062, ****p < 0.0001. |