
Fig. 3
- ID
- ZDB-FIG-170222-51
- Publication
- Akbalik et al., 2017 - Visualization of newly synthesized neuronal RNA in vitro and in vivo using click-chemistry
- Other Figures
- All Figure Page
- Back to All Figure Page
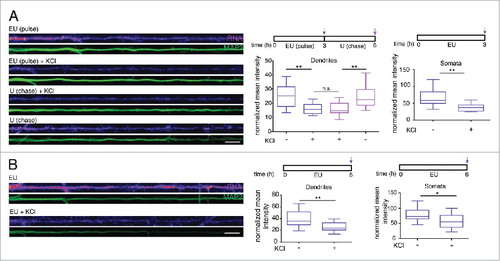
Depolarization of hippocampal neurons induces a decrease in detectable nascent RNA in the somata and dendrites. (A, B) Left panels: Representative dendrites showing a decrease in newly synthesized RNA signal after KCl treatment. The dendritic marker MAP2, green. Scale bars, 10 μm. Right panels: Graph showing the average intensity of RNA fluorescence in dendrites (n = 10–16) or somata (n = 9–19) in MAP2-defined dendritic area. Nascent RNA signal decreased significantly in both dendrites (top, **p = 0.0043, n.s. = 0.9999, **p = 0.0093, respectively; bottom, **p = 0.0023) and somata (top, **p = 0.0029, bottom, *p = 0.0129) following KCl treatment. |