
Fig. 2
- ID
- ZDB-FIG-170222-50
- Publication
- Akbalik et al., 2017 - Visualization of newly synthesized neuronal RNA in vitro and in vivo using click-chemistry
- Other Figures
- All Figure Page
- Back to All Figure Page
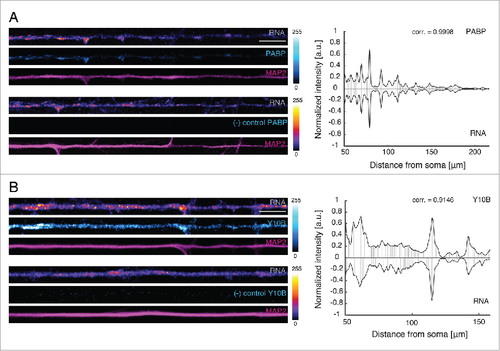
PABP and Y10B colocalize with newly synthesized RNA. (A, B) Left panels: Representative dendrites showing the colocalization of the fluorescent signals from PABP or Y10B and nascent RNA. Only a defined length (104 μm) of the original straightened dendrite is shown. Antibody leave-out control (no anti-PABP) does not show any signal. Scale bars: 10 μm. LUT for PABP, Cyan Hot; LUT for RNA, Fire (pixel intensities 0–255). The dendritic marker MAP2, magenta. Right panels: Graph of the correlation of the signal from RNA granules and PABP or Y10B along the original length of the representative dendrites shown. corr., correlation coefficient. |