
|
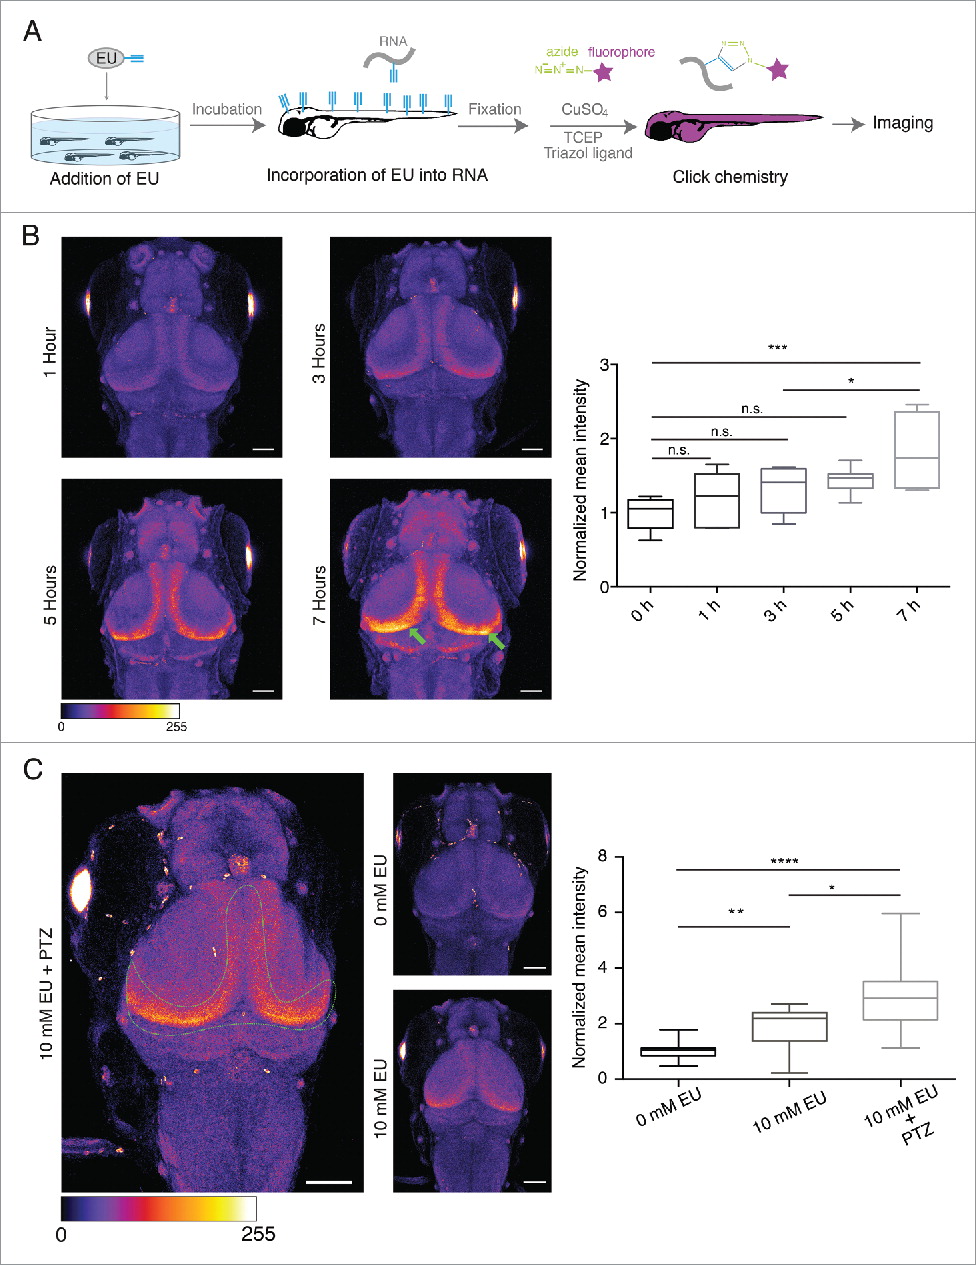
Fig. 4
In vivo labeling of newly synthesized RNA in the larval zebrafish brain. (A) Experimental procedure. (B) Left. Representative images of the larval zebrafish head (dorsal view) showing the time-dependent increase in nascent RNA signal in specific regions (green arrows) of the tectum. LUT, Fire (pixel intensities 0–255). Right. Graph representing the time-dependent increase in the normalized mean fluorescence intensity of RNA signal for the indicated conditions. Scale bar, 25 μm. n = 7–9 larvae from 2 independent experiments. *p = 0.0221, p = 0.0001, n.s., (not significant). LUT, Fire. (C) Left. Representative images of the larval zebrafish head (dorsal view) showing PTZ-induced increase in the newly synthesized RNA signal in the indicated region of the tectum. Scale bar, 25 μm. LUT, Fire (pixel intensities 0–255). Right. Graph representing the PTZ- induced increase in the normalized mean intensity of the newly synthesized RNA signal for the indicated conditions. n = 22–24 larvae from 4 independent experiments. *p = 0.0133, **p = 0.0062, ****p < 0.0001.