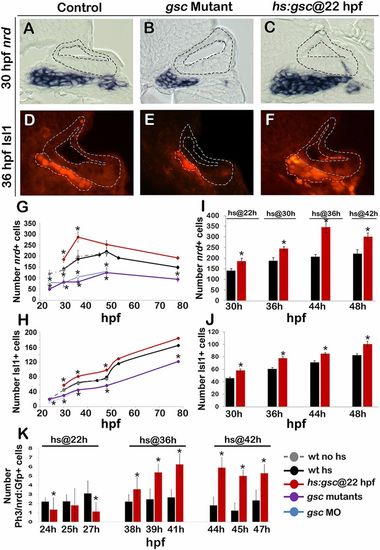
Effects of Gsc on later stages of SAG development. (A–F) Cross-sections passing through the utricular sensory epithelium (dorsal up, medial left) in controls, gsc mutants, and hs:gsc embryos showing expression of nrd (A–C) or Isl1 (outlined in orange, D–F). The otic epithelium is outlined in all images. (Magnification: A–F, 640×.) (G–J) Mean and SD of the total number of nrd+ (G and I) or Isl1+ (H and J) cells for the genotypes indicated in the color key at times presented on the x axes. nrd+ cells were counted on serial sections (n = 3–5), and Isl1+ cells were counted on whole mounts for time points between 30 and 48 hpf (n = 10–17) and on serial sections for 53 and 78 hpf (n = 2–3). (K) Means and SD of the total number of Phospho-Histone H3 (pH3)+ cells within the nrd:Gfp+ domain (which marks TA cells) at the indicated times in control and hs:gsc embryos. Embryos were heat shocked at the indicated times. Asterisks indicate statistically significant differences compared with control embryos (P < 0.05).
|
