
Fig. 3
- ID
- ZDB-FIG-161103-22
- Publication
- Perez-Camps et al., 2016 - Quantitative imaging reveals real-time Pou5f3-Nanog complexes driving dorsoventral mesendoderm patterning in zebrafish
- Other Figures
- All Figure Page
- Back to All Figure Page
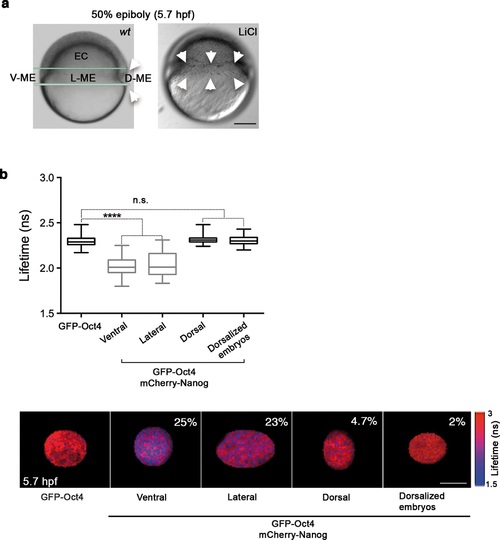
Oct4 and Nanog complexes in the ventrolateral mesendoderm. (a) wt embryo showing the ventral (V)-lateral (L)- and dorsal (D)-mesendoderm (ME) at the 50% epiboly [5.7 hr post-fertilization (hpf)] before commencement of involution. LiCl-dorsalized embryo at 5.7 hpf. Arrows show the dorsal organizer of the wt embryo and radialized dorsal structures along the germ ring of dorsalized embryos. Scale bar: 200 µm (b) Lifetime values and FLIM images of GFP-Oct4 lifetime alone and in the presence of mCherry-Nanog in the nuclei of individual cells measured at different locations within the mesendoderm. Values represent the median and quartile ranges of data from three to five independent experiments (n = 30-70 cell nuclei from 10 to 15 embryos; ****p<0.0001). The percentage of binding is indicated at the top right corner of the FLIM images. Scale bar: 5 µm. n.s. over bars indicates non-significant differences. See also Figure 3-figure supplements 1,2 and Figure 3-source data 1. |