
Fig. 6
- ID
- ZDB-FIG-160907-12
- Publication
- Lv et al., 2016 - Synaptic Ribbons Require Ribeye for Electron Density, Proper Synaptic Localization, and Recruitment of Calcium Channels
- Other Figures
- All Figure Page
- Back to All Figure Page
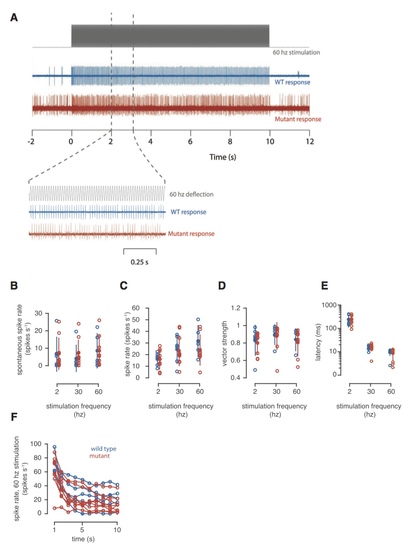
Electrophysiology Recordings from the Primary Afferent Neurons of Lateral Line Neuromasts (A) Representative traces showing the spiking rates for the afferent neurons of WT (blue) and mutant (red) zebrafish in response to 10 s of 60-Hz sine wave stimulation. (B) The spontaneous spike rate measured for WT and mutant animals before stimulation. (C) The average spike rate calculated over the entire 10 s of stimulation for stimulation frequencies of 2, 30, and 60 Hz. (D) The average vector strength calculated for the entire 10 s of stimulation. (E) The latency between the onset of stimulation and the first spike. (F) The spike rate as a function of time during 10 s of 60 Hz stimulation. Closed circles show the mean; error bars indicate SD.
|
| Fish: | |
|---|---|
| Observed In: | |
| Stage Range: | Day 4 to Day 6 |