
Fig. 4
- ID
- ZDB-FIG-160907-11
- Publication
- Lv et al., 2016 - Synaptic Ribbons Require Ribeye for Electron Density, Proper Synaptic Localization, and Recruitment of Calcium Channels
- Other Figures
- All Figure Page
- Back to All Figure Page
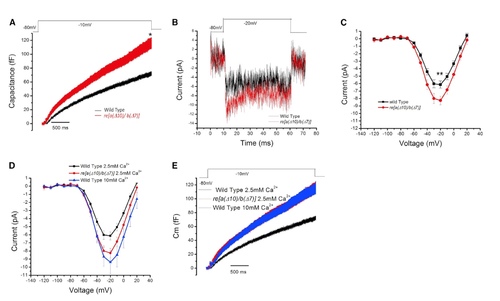
Results from Whole-Cell Voltage-Clamp Recordings from WT and re[a(Δ10)/b(Δ7)] Homozygous Mutant Neuromast Hair Cells (A) Average whole-cell capacitance measurements of WT (black, n = 11) and re[a(Δ10)/b(Δ7)] homozygous mutants (red, n = 12) neuromast hair cells in response to 3-s step-depolarizations. Note that all traces include error bars denoting SEM for each condition. The average capacitance increase at the end of the 3-s depolarization (averaged over 100 ms) was 67.8 ± 5.0 fF for the WT hair cells and was 106.1 ± 13.6 fF in the mutants. p = 0.018. (B) Averaged calcium current trace of WT (black) and re[a(Δ10)/b(Δ7)] homozygous (red) mutants in response to a 20-mV step depolarization. (C) Plot of current-voltage relationship for WT fish NM hair cells (black, n = 15) and re[a(Δ10)/b(Δ7)] homozygous mutant neuromast hair cells (red, n = 17). At 20 mV, the average current in WT cells was 6.1 ± 0.5 pA, and mutant fish cells was 8.3 ± 0.6 pA. p = 0.010. The fish recorded were between 5 and 8 days old, and the neuromasts recorded were P3 and P4. (D) Capacitance recording of WT fish at 2.8 mM Ca2+ (black) and 10 mM Ca2+ (blue) external solution and double-mutant fish at 2.8 mM Ca2+ external solution (red) in response to a 3-s step depolarization. The average capacitance increase at the end of the 3-s depolarization (averaged over 100 ms) was 105.09 ± 13.74 fF for the WT hair cells at 10 mM Ca2+ solution. Capacitance increases in WT and double-mutant fish in 2.8 Ca2+ external solution are the same as in (A). (E) Plot of current-voltage relationship of WT fish at 2.8 mM Ca2+ (black) and 10 mM Ca2+ (blue) external solution, and double-mutant fish at 2.8 mM Ca2+ external solution (red). At 20 mV, the calcium current of WT fish in 10 mM Ca2+ external solution is 9.39 ± 1.40 pA, compared to double-mutant fish in 2.8 mM Ca2+ external solution is 8.26 ± 0.58 pA. |
| Fish: | |
|---|---|
| Observed In: | |
| Stage Range: | Day 5 to Days 7-13 |