
FIGURE
Fig. S4
Fig. S4
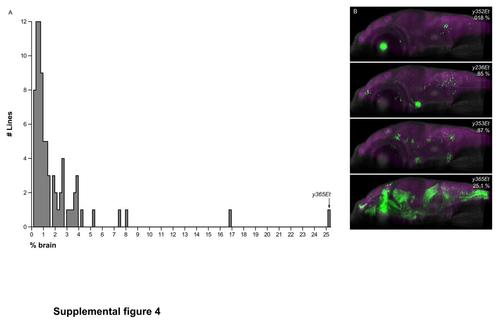
Extent of brain expression in Gal4 enhancer trap lines. (A)Histogram of the extent of brain coverage for the 80 Gal4 enhancer trap lines imaged in this study.(B) Sagittal hemi-projection for the line with the most restricted Gal4 expression pattern y352Et, for two lines with close to the median extent of Gal4 expression (y236Et and y353Et) and for the line with the broadest Gal4 expression pattern included in the database, y365Et. |
Expression Data
Expression Detail
Antibody Labeling
Phenotype Data
Phenotype Detail
Acknowledgments
This image is the copyrighted work of the attributed author or publisher, and
ZFIN has permission only to display this image to its users.
Additional permissions should be obtained from the applicable author or publisher of the image.
Full text @ Front. Neural Circuits