
FIGURE
Fig. S3
Fig. S3
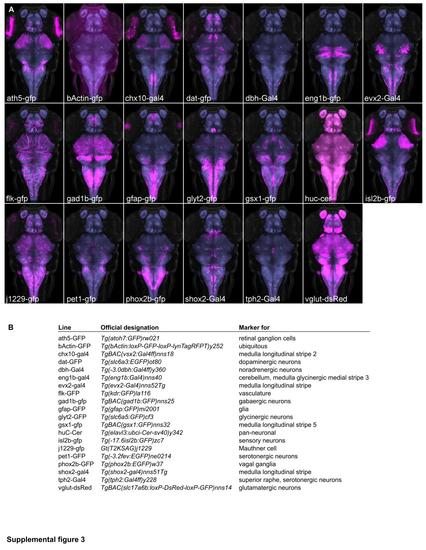
Transgenic lines providing neuroanatomical markers. Maximum projections (A) and expression domains (B) of transgenic lines that were imaged as part of this study. Gal4 lines were visualized using UAS:GFP (magenta). Background: ubiquitous βactin:Switch (gray) and pan-neuronal HuC:Cer (blue, after brain mask applied). |
Expression Data
Expression Detail
Antibody Labeling
Phenotype Data
Phenotype Detail
Acknowledgments
This image is the copyrighted work of the attributed author or publisher, and
ZFIN has permission only to display this image to its users.
Additional permissions should be obtained from the applicable author or publisher of the image.
Full text @ Front. Neural Circuits