
FIGURE
Fig. 2
Fig. 2
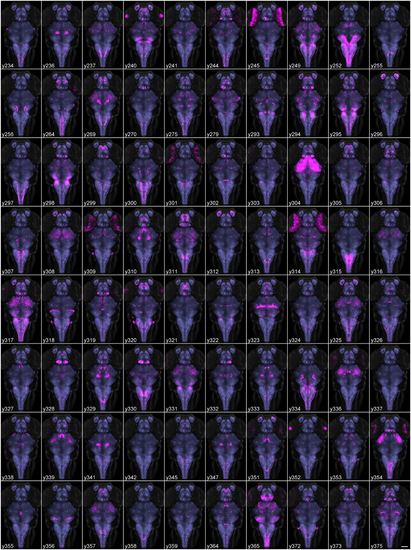
Average brain representations of Gal4 enhancer trap lines. Maximum projections through 80 Gal4 enhancer trap lines that were imaged, registered and averaged for this study. Gal4 expression was visualized using the UAS:Kaede transgenic line (magenta). Each panel is the average of at least three brains. For contrast, each panel also shows ubiquitous ²actin:Switch expression (gray) and pan-neuronal HuC:Cer expression (blue, after application of brain mask). Scale bar (bottom right panel) 100 µm. |
Expression Data
Expression Detail
Antibody Labeling
Phenotype Data
Phenotype Detail
Acknowledgments
This image is the copyrighted work of the attributed author or publisher, and
ZFIN has permission only to display this image to its users.
Additional permissions should be obtained from the applicable author or publisher of the image.
Full text @ Front. Neural Circuits