
Fig. S2
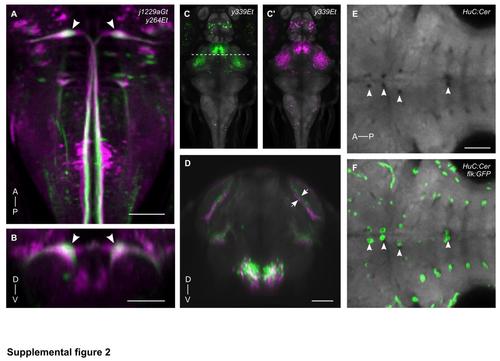
Assessing registration accuracy by colocalized Gal4 reporter gene expression. Dorsal (A) and transverse (B) views of brain browser projections for enhancer trap line y264Tg (green) and transgenic line j1229aGt (magenta) in the region including the Mauthner cells (arrowheads). (C,C′) Dorsal view of maximum projection of average representations of y339Et, made from two independent sets of three embryos each. Dotted line shows location of transverse slice shown in (D). (D) Slice through the midbrain and diencephalon of superimposed y339Et averages. In the right optic tectum, a neuropil layer (arrows) in the averages is misaligned by 1-2 cell diameters. (E) Horizontal view of a slice through the hindbrain from HuC:Cer average brain. Arrowheads indicate gaps in the tissue lacking neuronal Cer expression. flk:GFP expression, which labels blood vessels, is superimposed in (F). Anterior (A), Posterior (P), Dorsal (D), Ventral (V). All scale bars 50 µm. |