
Fig. 3
- ID
- ZDB-FIG-160503-19
- Publication
- Jeradi et al., 2016 - Retinoic acid-induced premature osteoblast-to-preosteocyte transitioning has multiple effects on calvarial development
- Other Figures
- All Figure Page
- Back to All Figure Page
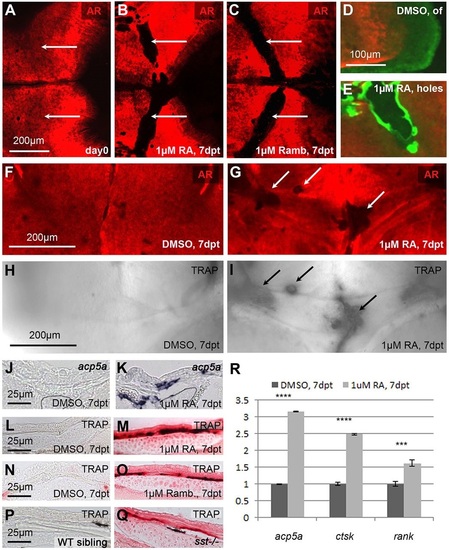
Treatment with RA or the Cyp26 inhibitor R115866 leads to calvarial bone fragmentation and ectopic osteoclast activation. (A-C) AR staining of SL9-10 fish before treatment (A) and after 7days of treatment with RA (B) or R115866 (Ramb; C); dorsal view of head region. White arrows point to similar areas at the level of the epiphyseal bar (compare with Fig. S5B), which is continuous before (A), but fragmented after (B,C) the treatment. (D,E) Consecutive in vivo AR staining directly before, and calcein (green) staining after the treatment. The newly synthesized matrix (green) at the sites of fragmentation in the RA-treated fish shows signs of hypermineralization (E; more intense green), in comparison with the newly synthesized matrix at the osteogenic front (of) of the DMSO-treated control (D). (F-I) In vivo AR staining (F,G), followed by enzymatic TRAP staining (H,I); epiphyseal bar region, anterior to the top. Ectopic TRAP is exclusively present in fragmented areas of RA-treated sample (G,I). (J-Q) Transverse sections through epiphyseal bar region showing in situ hybridization for mRNA of the TRAP-encoding gene acp5a (J,K) or enzymatic TRAP staining (L-Q). (J-M) RA-treated fish display ectopic acp5a expression and TRAP activity. (N-Q) Increased TRAP activity is displayed in corresponding regions of fish treated with the Cyp26 inhibitor R115866 (Ramb; O) and in an sst mutant, homozygous for a hypomorphic cyp26b1 mutation (Q). At this level, the calvarial plate of the sst mutant is much thinner than in the wild-type sibling (see Fig. S5E,F for magnifications). (R) qRT-PCR analysis of isolated calvarial plates: the expression of marker genes of active osteoclasts (acp5a, ctsk and rank) is significantly upregulated in RA-treated samples compared with DMSO controls. ***P<0.001, ****P<0.0001. |