
Fig. 2
- ID
- ZDB-FIG-160503-18
- Publication
- Jeradi et al., 2016 - Retinoic acid-induced premature osteoblast-to-preosteocyte transitioning has multiple effects on calvarial development
- Other Figures
- All Figure Page
- Back to All Figure Page
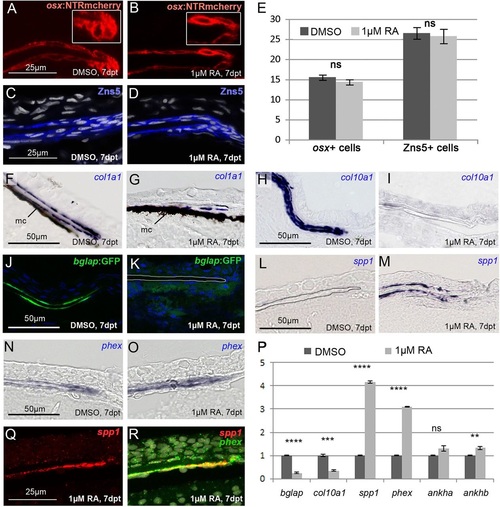
RA induces premature osteoblast-to-preosteocyte transitioning at osteogenic fronts. (A-D,F-R) Transverse sections through the osteogenic front region of a frontal calvarial plate of SL8-9 wild-type fish treated as indicated. (A,B) The number of osx-expressing cells assessed in tg(osx:NTR-mCherry) is unaltered upon RA treatment. However, at the osteogenic front, cells lose their globular shape (see insets for magnification). (C,D) Immunofluorescence with Zns5 antibody, counterstained with DAPI, reveals unaltered numbers and distributions of osteogenic cells upon RA treatment. (E) Quantification of osx- and Zns5-positive cells in corresponding regions at the osteogenic front. DMSO: n=8; RA: n=10. Mean values±s.d. are shown. (F-I) In situ hybridizations, revealing strongly impaired expression of the collagen genes col1a1 (F,G) and col10a1 (H,I) in bone-lining cells of RA-treated fish. In F,G, H2O2 treatment had been omitted, leaving the melanocytes (mc) of the meninges (Goldgeier et al., 1984) visible as black cells. (J,K) Expression of bglap as assessed in tg(bglap:GFP) is downregulated in the RA-treated samples. In K, the borders of the calvarial plate are outlined. (L-O) In situ hybridizations, revealing increased expression of spp1 (L,M) and the preosteocyte marker phex (N,O) in bone-lining cells of the RA-treated fish. (P) qRT-PCR analyses of isolated calvaria: the RA-treated sample displays a highly significant downregulation of the osteoblast markers bglap and col10a1, and a highly significant upregulation of the preosteocyte markers phex and spp1, whereas ankha and ankhb, other mammalian osteocyte markers (Franz-Odendaal et al., 2006; Laue et al., 2011), were not increased or only moderately increased. (Q,R) Double fluorescence in situ hybridization revealing coexpression of spp1 (red; single channel in Q) and phex (green; merged image in R; counterstained with DAPI in white) in bone-lining cells of RA-treated fish. **P<0.01, ***P<0.001, ****P<0.0001, ns, not significant. |