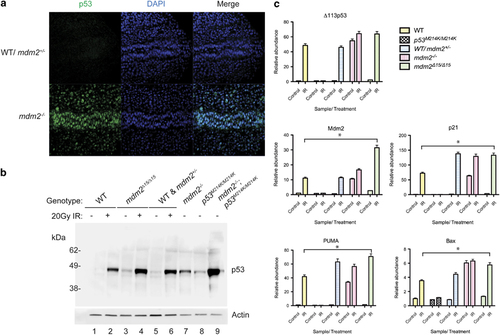
mdm2-/- embryos accumulate high levels of p53 protein and have increased p53 target gene transcription. (a) Whole mount immunohistochemistry was performed on embryos from an incross of mdm2+/- fish. The embryos were fixed in methanol:acetone (1:1) at the six-somite stage and stained with p53-5.1 hybridoma supernatant (green) and DAPI counterstain (blue). The stained embryos were deyolked, dorsally mounted in glycerol and imaged at the trunk at a × 40 magnification on a confocal microscope. (b) Western blot analysis on lysates of embryos from different incrosses—wild type, mdm2Δ15/15, mdm2+/-, p53M214K/M214K and mdm2-/-; p53M214K/M214K. A unit of 20 Gy gamma irradiation was performed on 24 hpf embryos and the total lysate from all embryos was collected at 28 hpf. A unit of 30 µg of lysate was loaded in each lane of the SDS-PAGE gel. (c) Quantitative real-time PCR analysis of p53 target genes in wild-type and mutant mdm2 embryos. RNA was extracted from 50 embryos at 24 hpf in TRIzol, and purified before utilizing 1 µg of total RNA in a reverse transcription reaction. A volume of 0.5 µl of each cDNA was used in a quantitative real-time PCR reaction set up in triplicate in a 384-well plate. The gene expression data was analyzed using actin and EF1a as internal controls. *P<0.05 for Student’s t-test.
|
