|
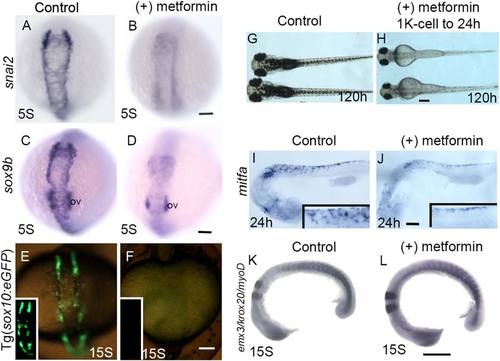
Metformin inhibits NC development in zebrafish. Control embryos (no metformin treatment, A, C, I, K), embryo with 25 mM metformin treatment (B, D, L), and embryos with 15 mM metformin treatment (J) were fixed at stages indicated in lower left. Expression of snai2 (A, B), sox9b (C, D), mitfa (I, J), and coexpression of emx3, krox20, and myod (K, L) were analyzed by in situ hybridization. Embryos from sox10:eGFP transgenic line were analyzed for reporter gene expression at 15-somite stage with 25 mM metformin treatment (F, F inset) and no treatment (E, E inset). Skin pigmentation at 120 hours in control embryos (G) and in embryos treated with 15 mM metformin (H, as indicated). Scale bar = 100 µm, (A-F) dorsal views, anterior to top, (G-L) lateral views anterior to the left; s, somite; ov, otic vesicle. All data are representative of at least three independent experiments.
|