
Fig. 3
- ID
- ZDB-FIG-160304-64
- Publication
- McPherson et al., 2016 - Motor Behavior Mediated by Continuously Generated Dopaminergic Neurons in the Zebrafish Hypothalamus Recovers after Cell Ablation
- Other Figures
- All Figure Page
- Back to All Figure Page
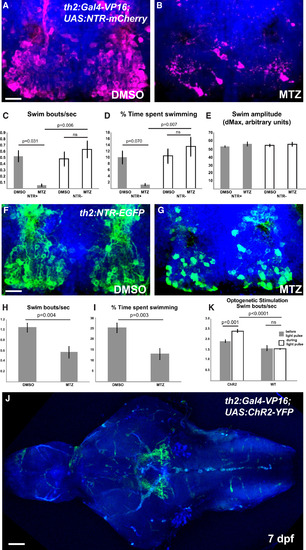
th2+ Cells Modulate the Initiation of Swimming Behavior (A and B) Representative brains of 8 dpf th2:Gal4-VP16; UAS:NTR-mCherry larvae treated with 0.5% DMSO (A) or 5 mM MTZ (B) from 5 to 7 dpf. (C–E) Effects of ablation on behavior in 8 dpf larvae as measured by swimming frequency (C), time spent swimming (D), and swim amplitude (E). Error bars represent SEM; n = 6 larvae for each condition except NTR+ fish treated with MTZ, wherein n = 5 due to exclusion of an outlier (p < 0.01; Grubbs’ test). Two-way ANOVA indicates a significant interaction between genotype and treatment for swim initiations (p = 0.009 for swim frequency; p = 0.020 for swim time), but not for swim amplitude. Adjusted p values shown for pairwise comparisons are based on Bonferroni multiple comparison test. (F and G) Representative brains from 8 dpf th2:NTR-EGFP larvae treated with 0.5% DMSO (F) or 5 mM MTZ (G) from 5 to 7 dpf. (H and I) Effects of ablation on swimming behavior in 8 dpf larvae as measured by swimming frequency (H) and time spent swimming (I). Error bars represent SEM; n = 8 individual larvae for each condition. p values based on Student’s t test. See also Figure S1for whole-animal images of NTR transgene expression, representative plots of swimming behavior, and control ablations of radial glia. (J) Representative brain of th2:Gal4: UAS:ChR2-YFP larva, showing that most axons appear to terminate nearby in the posterior tuberculum. See also Movie S3. (K) Average swim bouts/s before and during blue-light pulse for individual larvae. Error bars represent SEM; n = 4 (wild-type); n = 5 (ChR2). Two-way ANOVA demonstrates significant interaction between genotype and light exposure (p = 0.0025). Adjusted p values shown for pairwise comparisons are based on Bonferroni multiple comparison test. Images in (A), (B), (F), (G), and (J) are ventral maximum intensity confocal z projections of the brain. The scale bar represents 10 µM. See also Figure S1 for whole-animal images of ChR2 expression and examples of neuronal activity and swimming behavior after stimulation. |