
- Title
-
Motor Behavior Mediated by Continuously Generated Dopaminergic Neurons in the Zebrafish Hypothalamus Recovers after Cell Ablation
- Authors
- McPherson, A.D., Barrios, J.P., Luks-Morgan, S.J., Manfredi, J.P., Bonkowsky, J.L., Douglass, A.D., Dorsky, R.I.
- Source
- Full text @ Curr. Biol.
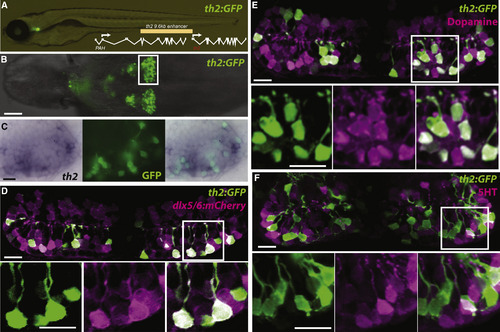
A th2:GFP Transgene Labels Dopaminergic Neurons Derived from a dlx5/6+ Precursor Lineage (A) Live zebrafish 7 dpf larva expressing th2:GFP with schematic of th2 enhancer/promoter region used for transgenes. (B) Ventral whole-mount view of th2:GFP expression in a dissected 7 dpf brain; box indicates area of posterior recess shown in (C)–(F). (C) Simultaneous in situ hybridization for th2 mRNA (left) and anti-GFP immunohistochemistry (middle) shows transcript expression in all th2:GFP+ cells (right). Ventral whole-mount view of a dissected 7 dpf brain is shown. (D) Co-expression analysis shows that most th2:GFP+ cells (green) express dlx5/6:mCherry (magenta), indicating their origin from dlx5/6+ precursors. (E) Co-expression analysis shows that most th2:GFP+ cells (green) express dopamine (magenta). (F) Co-expression analysis shows that few th2:GFP+ cells (green) express serotonin (magenta). All images in (D)–(F) are ventral maximum intensity confocal z projections of the hypothalamic posterior recess from dissected 7 dpf brains. Individual and merged channels of boxed regions are shown in the lower panels. The scale bar in (B) represents 50 µm; all other scale bars represent 10 µM. |
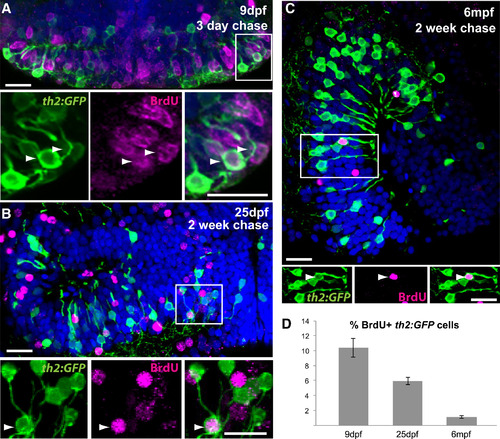
th2+ Cells Are Continuously Generated throughout Life (A) 5 dpf larvae were treated with BrdU for 24 hr and analyzed at 9 dpf. Numerous th2:GFP+ cells (green) are labeled with BrdU (magenta) in the hypothalamic posterior recess. Arrowheads indicate double-labeled cells. (B) 12 dpf larvae were treated with BrdU for 24 hr and analyzed at 25 dpf. th2:GFP+ cells (green) labeled with BrdU (magenta) can be found in medial regions of the hypothalamic posterior recess. Arrowheads indicate double-labeled cells. (C) 6 mpf fish were injected interperitoneally with BrdU and analyzed 2 weeks later. th2:GFP+ cells (green) labeled with BrdU (magenta) can be found in a midsagittal view of the hypothalamic posterior recess. Arrowheads indicate double-labeled cells. (D) Percent of BrdU+ cells in the th2:GFP+ population throughout the entire posterior recess. Error bars represent SEM; n = 5 brains. Images in (A) and (B) are ventral maximum intensity confocal z projections of the hypothalamic posterior recess. Images in (C) are maximum intensity confocal z projections from midsagittal views of the hypothalamic posterior recess. Individual and merged channels of boxed region are shown in the lower panels. The scale bars represent 10 µM. |
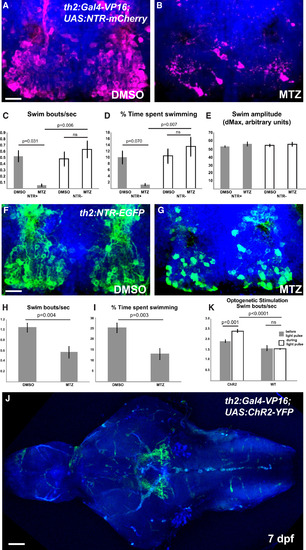
th2+ Cells Modulate the Initiation of Swimming Behavior (A and B) Representative brains of 8 dpf th2:Gal4-VP16; UAS:NTR-mCherry larvae treated with 0.5% DMSO (A) or 5 mM MTZ (B) from 5 to 7 dpf. (C–E) Effects of ablation on behavior in 8 dpf larvae as measured by swimming frequency (C), time spent swimming (D), and swim amplitude (E). Error bars represent SEM; n = 6 larvae for each condition except NTR+ fish treated with MTZ, wherein n = 5 due to exclusion of an outlier (p < 0.01; Grubbs’ test). Two-way ANOVA indicates a significant interaction between genotype and treatment for swim initiations (p = 0.009 for swim frequency; p = 0.020 for swim time), but not for swim amplitude. Adjusted p values shown for pairwise comparisons are based on Bonferroni multiple comparison test. (F and G) Representative brains from 8 dpf th2:NTR-EGFP larvae treated with 0.5% DMSO (F) or 5 mM MTZ (G) from 5 to 7 dpf. (H and I) Effects of ablation on swimming behavior in 8 dpf larvae as measured by swimming frequency (H) and time spent swimming (I). Error bars represent SEM; n = 8 individual larvae for each condition. p values based on Student’s t test. See also Figure S1for whole-animal images of NTR transgene expression, representative plots of swimming behavior, and control ablations of radial glia. (J) Representative brain of th2:Gal4: UAS:ChR2-YFP larva, showing that most axons appear to terminate nearby in the posterior tuberculum. See also Movie S3. (K) Average swim bouts/s before and during blue-light pulse for individual larvae. Error bars represent SEM; n = 4 (wild-type); n = 5 (ChR2). Two-way ANOVA demonstrates significant interaction between genotype and light exposure (p = 0.0025). Adjusted p values shown for pairwise comparisons are based on Bonferroni multiple comparison test. Images in (A), (B), (F), (G), and (J) are ventral maximum intensity confocal z projections of the brain. The scale bar represents 10 µM. See also Figure S1 for whole-animal images of ChR2 expression and examples of neuronal activity and swimming behavior after stimulation. |
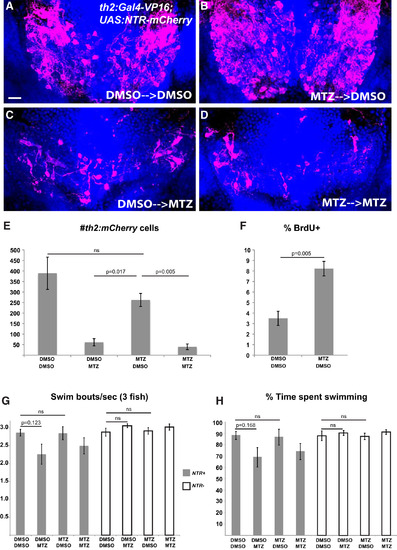
th2+ Cells Are Replaced after Ablation and Mediate Functional Recovery of Swimming Behavior (A–D) Representative brains from th2:Gal4-VP16; UAS:NTR-mCherry larvae that were treated with 0.5% DMSO or 5 mM MTZ from 5 to 7 dpf, followed by 10 mM BrdU from 8 to 10 dpf and allowed to recover for 2 weeks (10–25 dpf) before acute treatments with 0.5% DMSO or 5 mM MTZ. (E) Recovery of th2+ cells measured by total cell number. Analysis of the four groups by two-way ANOVA indicates that the 25 dpf treatment has a significant effect on the number of th2:mCherry cells at 28 dpf (p = 0.0001), whereas the 7 dpf treatment does not (p = 0.082); nor is there a significant interaction between two successive treatments (p = 0.20). Adjusted p values shown for pairwise comparisons are based on Bonferroni multiple comparison test. n = 3 brains for larvae untreated at 7 dpf; n = 4 brains for larvae treated with MTZ at 7 dpf. (F) Percent labeled by BrdU at 8 dpf. Error bars represent SEM; n = 5 brains. p value based on Student’s t test. (G and H) Recovery of behavior 3 weeks after ablation as measured by swimming frequency (G) and time spent swimming (H); n = 5 groups for each condition except n = 4 for wild-type larvae treated with MTZ plus DMSO after exclusion of an outlier (p < 0.001; Grubbs’ test). Statistical analyses were performed separately for the wild-type and NTR+ larvae. Two-way ANOVA of wild-type larvae shows no significant effect of either the 7 dpf treatment (p = 0.95 for swim frequency; p = 0.89 for swim time) or the 25 dpf treatment (p = 0.13 for swim frequency; p = 0.37 for swim time) at 28 dpf, and there is no significant interaction between the successive treatments (p = 0.66 for swim frequency; p = 0.76 for swim time). For NTR+ larvae, two-way ANOVA indicates that the 7 dpf treatment does not affect swimming behavior at 28 dpf (p = 0.60 for swim frequency; p = 0.80 for swim time), whereas the 25 dpf treatment has a significant effect (p = 0.034 for swim frequency; p = 0.032 for swim time). There was no significant interaction between the successive treatments (p = 0.55 for swim frequency; p = 0.64 for swim time). Adjusted p values shown for pairwise comparisons are based on Bonferroni multiple comparison test. Images in (A)–(D) are ventral maximum intensity confocal z projections of the hypothalamic posterior recess. The scale bar represents 10 µM. See also Figure S2 for representative plots of swimming behavior in ablated and unablated animals. |
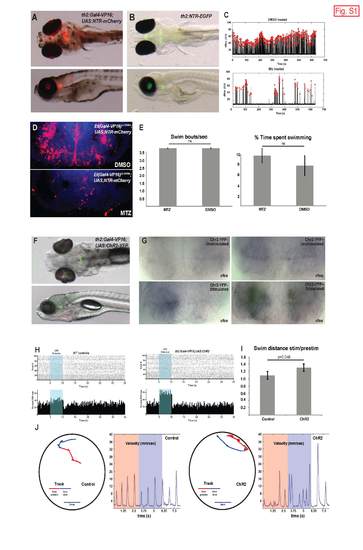
(A-B) Live 7 dpf larvae expressing th2:Gal4-VP16;UAS;NTR-mCherry (A) and th2:NTR-EGFP (B). (C) Representative behavioral plots of single 8 dpf larvae from same cohort analyzed in Figure 3. Each red arrowhead indicates a swim bout, defined as a superthreshold spike in the running frame subtraction trace, which is plotted as a black line. Y-axis indicates the maximum pixel displacement for each frame, in arbitrary units. (D-E) Effects of ablation of hypothalamic radial glia on behavior in 8 dpf larvae. Larvae expressing Et(Gal4-VP16)zc1066a; UAS;NTR-mCherry were treated with 0.5% DMSO or 5mM MTZ from 5-7 dpf as described for th2+ cell ablations. Error bars=SEM, n=6 larvae for each condition. (F) Live 7 dpf larva expressing th2:Gal4-VP16;UAS;ChR2- YFP. (G) Expression of cfos in the posterior recess of 7 dpf larvae that were unstimulated, or stimulated for 30 seconds with 470nm light once per minute for 10 minutes. The experiment was performed twice on groups of 10 larvae for each condition, processed simultaneously. While there was variability in expression between individual animals, in blind scoring all the stimulated Chr2+ larvae showed higher cfos staining than larvae in any other group. (H) Raster plots and cumulative counts of swim bouts before, during (blue shading), and after light pulse summing all trials for one dish of 10 larvae quantified in Figure 3K. Histogram bins are 200 ms wide. All fish exhibited a visually mediated transient reduction in swimming at light offset. (I) Tracking analysis reveals that fish expressing ChR2 exhibit an increased cumulative displacement during the 3s of optogenetic stimulation versus the 3s baseline condition. Error bars=SEM, n=24 control larvae, n=25 Chr2+ larvae. (J) Increased displacement reflects an increase in swim bout frequency. In the left panels, swim trajectories are color-coded to indicate the baseline (red) and stimulus (blue) periods. Right panels depict the instantaneous velocities vs. time for each trial. |