
FIGURE
Fig. S6
- ID
- ZDB-FIG-160218-24
- Publication
- Jahangiri et al., 2016 - The AP-1 transcription factor component Fosl2 potentiates the rate of myocardial differentiation from the zebrafish second heart field
- Other Figures
- All Figure Page
- Back to All Figure Page
Fig. S6
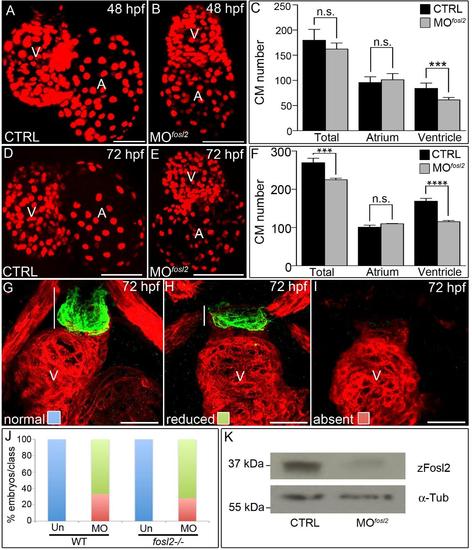
Analysis of fosl2 morphants. (A,B,D,E) Confocal images of hearts in 48 hpf (A,B) and 72 hpf (D,E) control sibling (CTRL; A; n=7 and D; n=12) and fosl2 morphant (B; n=6 and E; n=7) Tg(cmlc2:dsRed2-nuc) embryos. (C,F) Bar graphs showing average total, atrial, and ventricular cardiomyocyte numbers in each experimental group at 48 hpf (C) and 72 hpf (F). Error bars represent one standard deviation. n.s., not significant. ***p<0.001. (G-I) Confocal images of ventricular and outflow tract (OFT) regions of 72 hpf control (G) and fosl2 morphant (H, I) embryos co-stained with antibodies recognizing striated muscle (red) or Eln2+ OFT smooth muscle (green) that demonstrate normal (G), reduced (H), or absent (I) OFT Eln2. White lines approximate the sizes of the OFTs. (J) Bar graph showing the percentages of morphant (WT embryos injected with the fosl2 morpholino; n=18 total) and morphant-mutant (fosl2-/- embryos injected with the morpholino; n=25 total) embryos that fall into each phenotypic class shown in (G-I). Uninjected (Un) WT (n=22) and fosl2-/- embryos (n=22) were used as controls. (K) Western blots of 30 hpf whole-embryo lysates from control and morphant embryos probed with Fosl2 (zFosl2) or α-Tubulin (α-Tub) antiserum. V, ventricle, A, atrium. |
Expression Data
Expression Detail
Antibody Labeling
Phenotype Data
Phenotype Detail
Acknowledgments
This image is the copyrighted work of the attributed author or publisher, and
ZFIN has permission only to display this image to its users.
Additional permissions should be obtained from the applicable author or publisher of the image.
Full text @ Development