
Fig. 3
- ID
- ZDB-FIG-160218-16
- Publication
- Jahangiri et al., 2016 - The AP-1 transcription factor component Fosl2 potentiates the rate of myocardial differentiation from the zebrafish second heart field
- Other Figures
- All Figure Page
- Back to All Figure Page
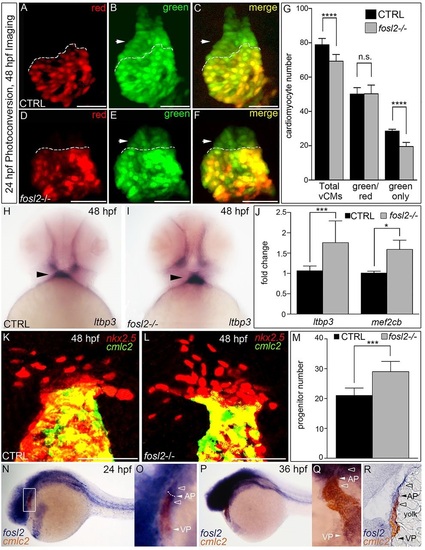
Fosl2 potentiates the progenitor to cardiomyocyte transition during SHF-mediated ventricular growth. (A-G) Cardiomyocyte photoconversion assay. Control sibling (CTRL; A-C; n=23) and fosl2fb16-/- (D-F; n=6) Tg(myl7:nlsKikGR) embryos were photoconverted at 24hpf and imaged by confocal microscopy at 48hpf in the red (A,D) and green (B,E) channels. Merged images are shown in C,F. Dashed lines highlight boundaries between cardiomyocytes that differentiated before (bottom) or after (top) photoconversion. Arrowheads highlight SHF-derived green-only cardiomyocytes. (G) Bar graph showing the mean numbers of total ventricular cardiomyocytes, green and red positive cardiomyocytes, and green-only cardiomyocytes. Error bars represent s.d. ****P<0.0001, n.s., not significant. (H,I) Ventral images of 48hpf control (H; n=16) and fosl2-null (I; n=5) embryos stained with a riboprobe for the SHF marker ltbp3. Arrowheads highlight extra-cardiac SHF progenitors. (J) Bar graph showing relative levels of the SHF markers ltbp3 (n=9 biological replicates per group) and mef2cb (n=3 biological replicates per group) in control and mutant embryos at 48hpf as measured by quantitative PCR. Error bars represent s.d. ***P<0.001, *P<0.05. (K,L) Confocal images of the arterial poles in control (K; n=12) and fosl2 mutant (L; n=4) embryos carrying the Tg(nkx2.5:nZsYellow) and Tg(cmlc2:GFP) transgenes co-stained with antibodies recognizing ZsYellow (red) or GFP (green). (M) Bar graph showing the mean numbers of extra-cardiac SHF progenitor cells (red nuclei without yellow cytoplasm) in both experimental groups. Error bars represent s.d. ***P<0.001. (N-R) Double in situ hybridization analysis of fosl2 (blue) and cmlc2 (red) in whole mounted (N-Q) and sagittally crysectioned (R) 24hpf (N,O) and 36hpf (P-R) embryos. Anterior is to the left in N-P,R. Boxed region in N is magnified in O. (Q) Anterior and dorsal view of the embryo following removal of the head. Open arrowheads in O,Q,R highlight fosl2+ cells on either side of the arterial pole (AP; closed arrowheads and dashed line in O). More than 20 embryos per group were evaluated. VP, venous pole. Scale bars: 50µm. |
| Fish: | |
|---|---|
| Observed In: | |
| Stage: | Long-pec |