
Fig. S3
- ID
- ZDB-FIG-160218-21
- Publication
- Jahangiri et al., 2016 - The AP-1 transcription factor component Fosl2 potentiates the rate of myocardial differentiation from the zebrafish second heart field
- Other Figures
- All Figure Page
- Back to All Figure Page
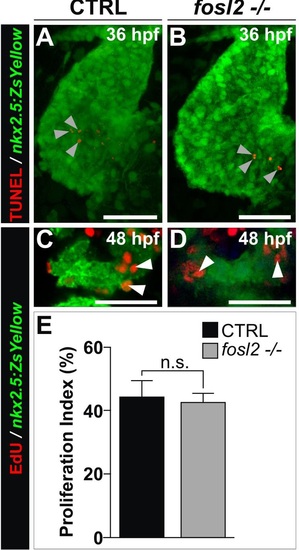
Analysis of proliferation and apoptosis in fosl2 mutants. (A,B) Confocal images of 36 hours post-fertilization (hpf) control sibling (CTRL; A; n=4) and fosl2-/- (B; n=4) Tg(nkx2.5:ZsYellow) embryos processed for the detection of apoptotic cells (red) using the TUNEL assay. Embryos were coimmunostained to detect the ZsYellow fluorescent protein (green). Although apoptotic cells were detected within the Z-stacks (arrowheads), they were never found overlapping ZsYellow+ myocardium in either experimental group. (C,D) Confocal images of the ZsYellow+ SHF in 48 hpf control (C; n=4) and fosl2fb16-/- (D; n=4) Tg(nkx2.5:ZsYellow) embryos double immunostained for ZsYellow (green) and EdU (red) following exposure to EdU at 36 hpf for 30 minutes. Embryos were co-stained with DAPI (not shown) to visualize all nuclei. (E) Bar graph showing the average percentages of DAPI+, ZsYellow+ cells that were also EdU+. Error bars represent one standard devision. n.s., not significant. Scale bars: 50µm in (A,B) and 25µm in (C,D). |