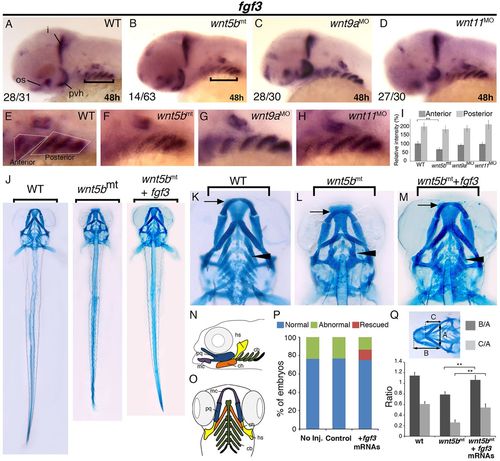
Ectopic expression of full-length fgf3 mRNAs rescues the jaw cartilage defects in wnt5b mutants. (A–D) Images showing fgf3 expression in wild-type (WT) (A), wnt5b mutant (wnt5bmt) (B), wnt9a-MO-injected (wnt9aMO) (C) and wnt11-MO-injected (wnt11MO) (D) embryos at 48hpf. i, isthmus; os, optic stalk; pvh, posterior-ventral hypothalamus. Brackets indicate the location where the prominent reduction of fgf3 expression is in the wnt5b mutant. (E–H) Enlarged pharyngeal regions from images in A–D. White dotted lines mark the regions of anterior or posterior pouches. (I) Signal intensity analyses for images E–H. (J) Images showing Alcian-Blue-stained jaw cartilages in WT larvae (left), or larvae injected with mRNA for wnt5bmt (middle) and wnt5bmt and fgf3 (wnt5bmt+fgf3) (right) at 96hpf. (K–M) Enlarged head regions from images in E. Arrows indicate the positions of Meckel′s cartilages. Arrowheads indicate where the ceratobranchial cartilages are. (N,O) Schematics showing the locations of Meckel′s cartilage (mc), and the ceratobranchial (cb), ceratohyal (ch), hyosymplectic (hs) and palatoquadrate (pq) cartilages. (P) The rescuing effects of fgf3 mRNA injection. The wnt5b ti265 allele is homozygous lethal, therefore normally only 25% mutants would be found in a given batch of embryos. The percentages of normal (blue bar), abnormal (green bar) and rescued (red bar) morphologies are 76.29%, 23.71% and 0% with no injection; 76.77%, 23.23% and 0% with control injection; and 75.14%, 13.7% and 11.16% with fgf3 mRNA injection. Phenotypes were scored at 4dpf from three independent experiments. (Q) Cartilage position analyses. The definition for A, B and C lines are described in the Materials and Methods. The B:A ratios (B/A) are 1.15 in WT, 0.79 in wnt5bmt, and 1.07 in wnt5bmt injected with fgf3 mRNAs. The C:A ratios (C/A) are 0.60 in WT, 0.26 in wnt5bmt, and 0.54 in wnt5bmt injected with fgf3 mRNAs. Images are lateral views in A–D and N; ventral views in E–H and O. Numbers in the bottom left corners in A–D indicate the number of the embryos showing the indicated phenotype and the total number examined (denominator). **P<0.05
|
