|
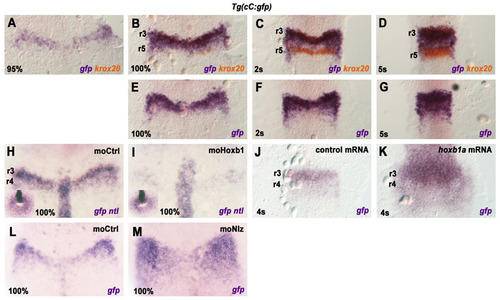
Dynamics of enhancer C activity and its regulation by Hox PG1 and Nlz factors. (A-G) Time-course analysis of enhancer C activity. The Tg(cC:gfp) line was analysed by double ISH with gfp (purple) and krox20 (orange) probes, at the indicated stages (A-D). Single ISH was also performed with the gfp probe (E-G). (H,I) Tg(cC:gfp) embryos were injected with a control morpholino (moCtrl) or morpholinos for hoxb1a and hoxb1b (moHoxb1), and subjected to ISH with gfp and ntl probes at 100% epiboly (three independent experiments). The insets show tailbud views of the embryos, allowing the developmental stage to be evaluated by extent of tailbud closure. (J,K) Tg(cC:gfp) embryos were injected with control or hoxb1a mRNA and subjected to ISH with a gfp probe at 4s (three independent experiments). (L,M) Tg(cC:gfp) embryos were injected with a control morpholino or morpholinos for nlz1 and nlz2 (moNlz), and subjected to ISH with a gfp probe at 100% epiboly.
|