
Fig. 2
- ID
- ZDB-FIG-150717-7
- Publication
- Stoyek et al., 2015 - Intrinsic and extrinsic innervation of the heart in zebrafish (Danio rerio)
- Other Figures
- All Figure Page
- Back to All Figure Page
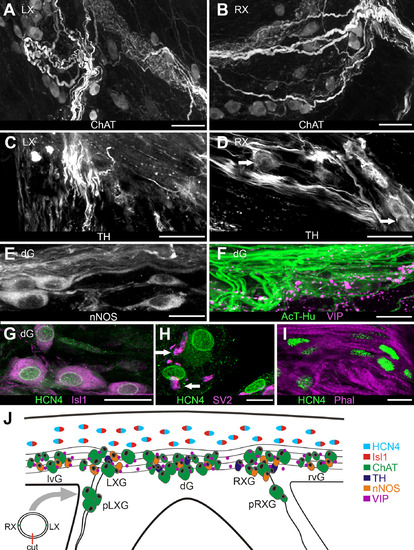
Localization of neurotransmitter-specific elements and presumptive pacemaker tissue in the sinoatrial valve region. A,B: Choline acetyltransferase (ChAT)-labeled axons and somata at junctions of left (A) and right (B) vagosympathetic nerves with SAP. C,D: Tyrosine hydroxylase (TH)-positive axons in same regions as shown in A,B. Arrows in D indicate TH-positive somata. E: Antineuronal nitric oxide synthase (nNOS)-labeled axons and somata in the dorsal SAP; somata were located in a ganglion here (dG). F: Vasoactive intestinal polypeptide (VIP)-positive axons and terminals were located in dorsal SAP. G: Putative pacemaker cells in base of dorsal sinoatrial valve were double labeled with antibodies against hyperpolarization-activated cyclic-nucleotide gated ion channels (HCN4) and Islet-1 (Isl1). H: Antisynaptic vesicle 2 (SV2) labeled axon terminals (arrows) proximal to HCN4-positive cells. I: HCN4-positive cells embedded in myocytes (Phal) in ventral valve leaflet. J: Schematic of SAP region oriented to show locations of elements expressing specific phenotypes (color-coding key on right side). To obtain this tissue orientation, a transverse cut was made through the ventral sinoatrial valve leaflet between junctions of the left and right vagosympathetic trunks with the SAP (diagram, lower left); tissue was then flattened and spread. Atrium is at upper edge of the panel. Neurons were clustered into ganglia (G) by region; from left to right these are left ventral (lvG), left vagal (LXG); dorsal (dG), right vagal (RXG); right ventral (rvG). In all preparations there were varying numbers of neurons in small ganglia associated with the vagosympathetic trunks near the SAP (proximal left and right vagal [pLXG, pRXG]). Putative pacemaker cells were doubly color coded to indicate combined HCN4-Isl1 labeling. Scale bars = 100 µm in A-D; 50 µm in E,F; 5 µm in G; 2 µm in H; 10 µm in I. |