
Fig. 6
- ID
- ZDB-FIG-150512-21
- Publication
- Bianco et al., 2015 - Visuomotor Transformations Underlying Hunting Behavior in Zebrafish
- Other Figures
- All Figure Page
- Back to All Figure Page
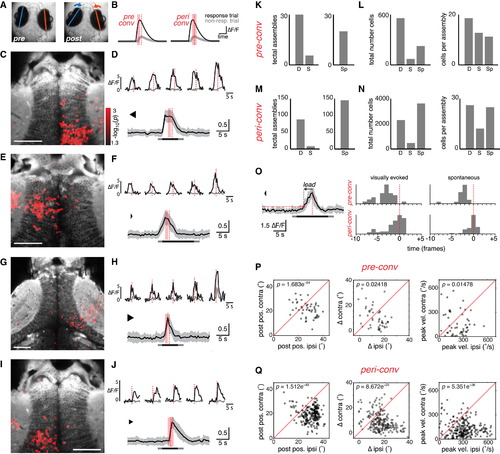
Assemblies of Tectal Neurons Show Premotor Activity Associated with Convergent Saccades (A) Eye position before and after a convergent saccade. (B) Schematic indicating time windows used to identify ROIs with a significantly greater GCaMP response immediately prior to a convergent saccade (“pre-conv”, left) or around the time of the saccade (“peri-conv”, right). Dashed red line indicates time of eye convergence in response trial. Shaded red bars indicate time windows during which activity (ΔF/F) was compared (t test) between response (black) versus non-response trials (gray). (C) Example of right tectal assembly that was active in advance of a convergent saccade (“pre-conv”). Response-modulated ROIs (red, color map indicates log-transformed p value from t test) are overlaid on an anatomical projection (gray). (D) Top: five cells from the assembly in (C). Activity in response trial in black, mean activity in non-response trials in gray. Bottom: activity of all cells in assembly in (C) during the response trial. To facilitate comparison of cells with different response amplitudes, we normalized ”F/F time courses to the maximum value for each cell before computing the population average, shown as mean ± SD. Bar indicates visual stimulus presentation (light gray, change in background luminance; dark gray, moving spot presentation). (E–H) Two more examples of “pre-conv” assemblies that were active in advance of convergent saccades. Assemblies are from two different fish that are also different from (C) and (D). (I) Left tectal assembly that was active around the time of a convergent saccade (“peri-conv”). Same fish as (C) and (D). (J) Responses of individual cells (top) and the whole assembly (bottom) shows activity coincident with, or immediately following, the convergent saccade. (K) Left: number of pre-conv assemblies identified in original data, “D” and after circular permutation of the timebase (shuffling, “S”). We estimated false discovery rate to be 19%. Right: number of pre-conv assemblies associated with spontaneous convergent saccades, “Sp”. (L) Total number of cells (left) and mean number of cells per assembly (right) for pre-conv assemblies. (M and N) Data for peri-conv assemblies, as per (K) and (L). False discovery rate was 9%. (O) Left: example illustrating detection of onset of assembly activity. Population activity of a pre-conv assembly is shown (mean ± SD). Horizontal red line indicates threshold. The population response crosses threshold at the time indicated by a red dot, which precedes the saccade by a certain lead time (arrow). Right: histograms of lead times for pre-conv (top) and peri-conv (bottom) assemblies associated with visually evoked (left) or spontaneous (right) convergences. x axis is marked in imaging frames, relative to time of saccade (frame zero). (P and Q) Oculomotor parameters associated with assembly activity. Post-saccadic eye position (left), change in eye position (middle), and peak nasal eye velocity (right) are compared for the eye ipsilateral to the assembly (ipsi) versus the eye contralateral to the assembly (contra). Positive values correspond to more nasal eye positions/rotations. For both types of assembly, the eye ipsilateral to the tectal assembly shows a larger post-saccadic eye position, a larger change in horizontal position and a larger peak velocity. p values obtained by paired t tests comparing ipsilateral versus contralateral eye. Data for visually evoked and spontaneous convergences are combined. See also Figures S5–S7. |