
Fig. 5
- ID
- ZDB-FIG-150512-20
- Publication
- Bianco et al., 2015 - Visuomotor Transformations Underlying Hunting Behavior in Zebrafish
- Other Figures
- All Figure Page
- Back to All Figure Page
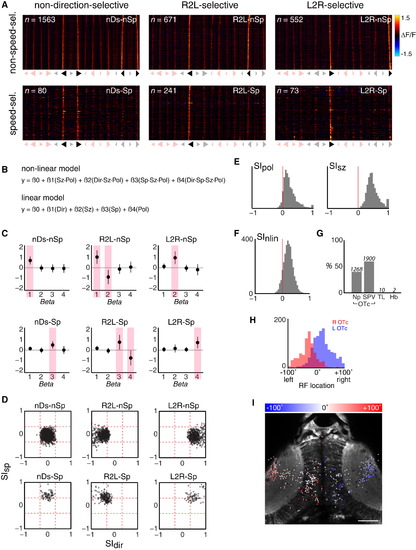
Tectal Neurons Show Non-linear Mixed Selectivity for Best Prey-like Stimuli (A) Visual response vectors (VRVs) of ROIs isolated using six regressors that were designed based upon the stimulus tuning of behavioral response rates. Symbols below each panel indicate the stimuli coded 1 in the binary vector defining the regressor. Stimuli coded 0 are shown in light shading. ROIs were associated with the regressor that produced the highest correlation coefficient, when that coefficient was 0.75 or greater. (B) Non-linear and linear models used to fit the response profiles of individual ROIs. y represents the fluorescence response (peak ΔF/F during stimulus presentation). Each stimulus is coded as a set of four binary feature values, as shown in Figure 2E. (C) Coefficients (β’s) derived from fitting the non-linear model in (B) to ROIs associated with each regressor. Shaded bars indicate coefficients expected to show significant non-zero values. Data are shown as mean ± SD. (D) Direction- and speed-selectivity indices (SIdir, SIsp) for ROIs associated with each regressor. (E) Polarity- and size-selectivity indices (SIpol, SIsz). (F) Comparison of model fits (R2) obtained with non-linear versus linear mixed selectivity models, quantified as a selectivity index, SInlin. The majority of ROIs show a positive index, indicating the non-linear model provides a more accurate description of the variance of their responses. (G) Anatomical distribution of ROIs. Values above each bar indicate number of ROIs. (H) Distribution of receptive field (RF) centers for NLMS neurons in the left (blue) and right (red) optic tecta. Only ROIs localized to the tectal SPV are shown. (I) Anatomical map of all NLMS ROIs in one example fish. Each spot indicates the centroid of an ROI, color-coded according to estimated RF location. ROIs located in both the tectal SPV and neuropil regions are shown. Note that for presentation, ROIs from the entire imaging volume are overlaid on a single anatomical image from the dorsoventral mid-point of the volume. Scale bar, 50 µm. See also Figure S4. |