
Fig. 3
- ID
- ZDB-FIG-150512-18
- Publication
- Bianco et al., 2015 - Visuomotor Transformations Underlying Hunting Behavior in Zebrafish
- Other Figures
- All Figure Page
- Back to All Figure Page
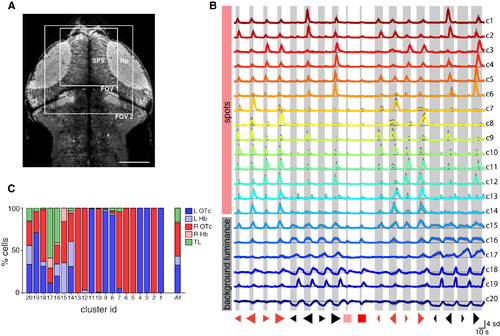
Clustering of Visual Response Properties (A) 2P focal plane showing a dorsal view of the brain of a 5 dpf Tg(elavl3:GCaMP5G) larva. Boxes indicate size and approximate locations of fields of view for functional imaging of the anterior optic tecta. The stratum periventriculare and synaptic neuropil regions of the right OTc are labeled. Anterior top. Scale bar, 100 µm. (B) Cluster centroids (mean visual response vectors) of 20 clusters of visually responsive neurons from 14 fish. For each cluster, the visual response vectors of constituent cells were divided by their SD (to normalize responses across cells with varying magnitudes of signal modulation), and the mean visual response vector was computed (colored lines). Thin black lines indicate zero ΔF/F. Gray shading indicates SD across cells. Numbers on the right are cluster IDs. Shaded bars indicate visual stimulus presentation periods. (C) Anatomical distribution of cells from each cluster. L, left; R, right; Hb, habenula; OTc, optic tectum; SPV, stratum periventriculare; Np, tectal neuropil; TL, torus longitudinalis. See also Figures S1–S3 and Table S1. |