
Fig. 4
- ID
- ZDB-FIG-150512-19
- Publication
- Bianco et al., 2015 - Visuomotor Transformations Underlying Hunting Behavior in Zebrafish
- Other Figures
- All Figure Page
- Back to All Figure Page
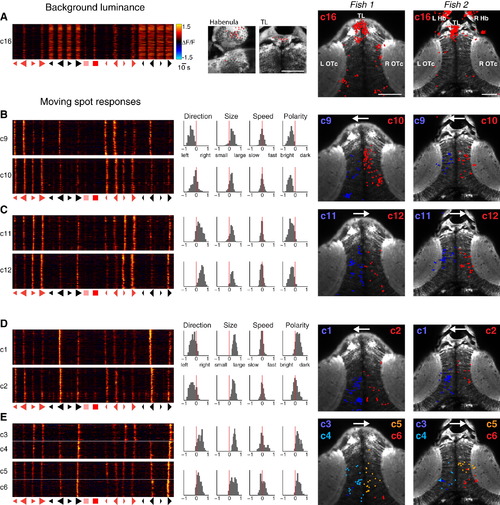
Clusters Respond to Background Luminance Changes and Show Mixed Selectivity to Multiple Features of Moving Spot Stimuli (A) Cluster 16 shows positive modulation in response to increases in whole-field luminance. The left panel shows VRVs for every cell in the cluster (each row corresponds to one cell). Neurons show increased calcium signals in response to the increased background luminance that occurs in conjunction with presentation of dark, moving spots, as well as in response to large bright spots and whole-field light flashes. Middle panels show locations of cluster 16 cells in the habenula and torus longitudinalis, and right panels show anatomical locations of all detected cluster 16 neurons in two representative larvae. Neuron locations are marked as x-y centroids (colored spots) overlaid on a single anatomical image from the dorsoventral mid-point of the imaging volume. Many cluster 16 cells are located in the torus longitudinalis and the habenulae. Scale bars, 50 µm. (B and C) Mirror-symmetric pairs of clusters showing a net preference for large, bright, moving spots. (B) Clusters 9 and 10 are tuned to leftward-moving stimuli and localize to the left and right optic tecta, respectively. (C) Clusters 11 and 12 are tuned to rightward-moving stimuli. Histograms show distributions of feature selectivity indices for cells in each cluster. Arrows on anatomical maps indicate preferred direction of motion. (D and E) Clusters responding to large, dark, moving spots. (D) Clusters 1 and 2 are tuned to leftward-moving large, dark spots. (E) Clusters 3–6 prefer rightward-moving stimuli. These clusters were divided based on differential response times, corresponding to different spatial receptive field locations. Accordingly, they occupy different positions in the tectal space map. |