
Fig. 1
- ID
- ZDB-FIG-150330-30
- Publication
- Fukui et al., 2014 - S1P-Yap1 Signaling Regulates Endoderm Formation Required for Cardiac Precursor Cell Migration in Zebrafish
- Other Figures
- All Figure Page
- Back to All Figure Page
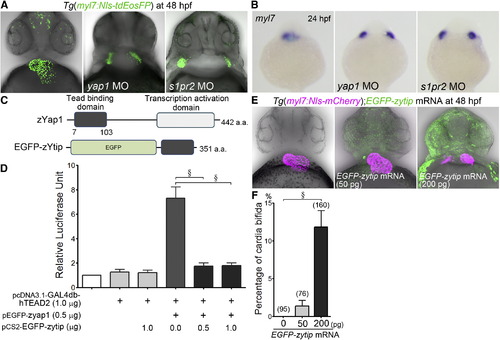
Yap1/Tead-Dependent Transcription Is Required for Cardiac Precursor Cell Migration toward Midline (A) 3D-rendered confocal stack merged images (bright field and fluorescence) of Tg(myosin light polypeptide 7 [myl7]:nuclear localization signal-tagged tandem EosFP [Nls-tdEosFP]) embryos (48 hr postfertilization [hpf]) uninjected (left) and injected with morpholino (MO) indicated (center and right). tdEosFP fluorescence is shown as green. Images displayed in the following figures are the 3D-rendered images of a stack. Images are ventral views unless otherwise described (anterior to the top). The confocal images and WISH images in the following figures are a set of representative images of at least four independent experiments. (B) WISH analyses of the embryos (24 hpf) of the wild-type (left) and those injected with the MO indicated (center and right) using antisense probe for myl7. A set of representative images of four independent experiments is shown. (C) A schematic illustration of zebrafish (z) Yap1 and EGFP-zYtip. The numbers, amino acids (aa); EGFP-zYtip, EGFP fused with a Tead binding domain (aa 7-103 of zYap1). (D) Luciferase activity of the 293T cells transfected with the plasmids coding upstream activation sequence (UAS) followed by luciferase cDNA together with the plasmids indicated at the bottom. zYap1 binding to human TEAD2 fused with a DNA-binding domain of GAL4 (GAL4 db-hTEAD2) could promote UAS-dependent transcription of luciferase. The graph shows the average with SEM of the relative luciferase unit normalized by the luciferase activity of untransfected cells (n = 6). (E) Images of Tg(myl7:Nls-mCherry) embryos at 48 hpf uninjected (left) and injected with mRNAs indicated at one-cell stage with 50 pg (center) and 200 pg (right) EGFP-zytip mRNA. mCherry image (pseudocolor magenta), EGFP image, and bright field image are merged. (F) Quantitative analyses of the incidence of cardia bifida of (E). The graph shows the percentage calculated by the number of the embryos exhibiting cardia bifida among the embryos injected with mRNAs indicated at the bottom. Total number of the embryos injected with mRNA is indicated on the top of column. Hereafter, total number of the embryos investigated is indicated on the top of the column. §p < 0.0001. See also Figure S1. |
| Genes: | |
|---|---|
| Fish: | |
| Knockdown Reagents: | |
| Anatomical Terms: | |
| Stage Range: | Prim-5 to Long-pec |
| Fish: | |
|---|---|
| Knockdown Reagents: | |
| Observed In: | |
| Stage Range: | Prim-5 to Long-pec |
Reprinted from Developmental Cell, 31, Fukui, H., Terai, K., Nakajima, H., Chiba, A., Fukuhara, S., Mochizuki, N., S1P-Yap1 Signaling Regulates Endoderm Formation Required for Cardiac Precursor Cell Migration in Zebrafish, 128-136, Copyright (2014) with permission from Elsevier. Full text @ Dev. Cell