
Fig. 3
- ID
- ZDB-FIG-150326-27
- Publication
- Schupp et al., 2014 - Transcriptional inhibition of etv2 expression is essential for embryonic cardiac development
- Other Figures
- All Figure Page
- Back to All Figure Page
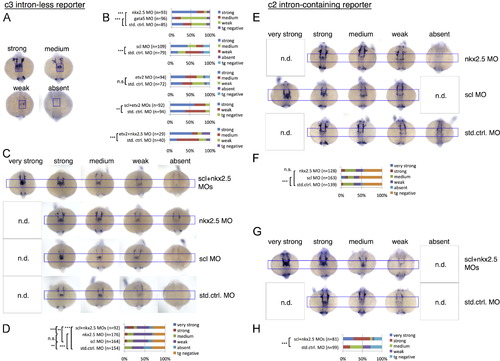
Changes in intron-less c3 transgene versus intron-containing c2 transgene expression magnitudes in the cardiac disc in response to single and combined knockdowns of key myocardial (gata5, nkx2.5) and endocardial/endothelial (scl, etv2) transcription factors. (A) Representative embryos post ISH showing four categories of c3 transgene expression magnitudes in the myocardial domain of the cardiac disc (blue frame) with transgene expression categories scored and quantified in (B1-5). Knockdown of nkx2.5 resulted in an increase, knockdown of gata5 in a decrease of c3 transgene expression (B1). Knockdown of scl also lead to an increase (B2), etv2 morphants however showed no significant change in c3 transgene expression (B3). Combined knockdown of scl and etv2 (B4) or nkx2.5 and etv2 (B5) again resulted in an increased c3 transgene expression indicating that scl and nkx2.5 (but not etv2) cooperate in c3 repression. (C-D) Combined knockdown of scl and nkx2.5 compared to single knockdowns showing cardiac disc expression categories of the c3 transgene in representative embryos (C) and quantification (D). Note that combined scl and nkx2.5 knockdown resulted in an additional category of “very strong” c3 transgene expressing embryos not seen in single knockdowns indicating synergism of scl and nkx2.5 in c3 transgene repression. (E) Representative embryos showing categories of c2 transgene expression in the endocardial domain of the cardiac disc following single knockdowns of scl and nkx2.5 and quantification in (F). (G) Combined knockdown of scl and nkx2.5 showing cardiac disc expression categories of the c2 transgene in representative embryos and quantification in (H). Note that single nkx2.5 knockdown resulted in significant change in c3 but not c2 transgene expression (compare D and F). Embryos shown are at 20-22 som stages in dorsal view with anterior to the top. *** indicates p≤0.001; ** indicates p≤0.01; * indicates p≤0.05; n.s.=not significant (p>0.05); n.d.=not detected; MO=morpholino; n=number of scored embryos; blue frame marks the endocardial cardiac disc expression domain of the c2 transgene. Categories of transgene expression magnitudes scored are color-coded in (B, D, F and H). Pooled F2 and F3 generations of two transgenic c3 lines were analyzed in A/B, and pooled F5 and F2 generations of 2 lines in C/D. F4 generation embryos of two c2 lines were analyzed in E-H. |
| Genes: | |
|---|---|
| Fish: | |
| Knockdown Reagents: | |
| Anatomical Terms: | |
| Stage: | 20-25 somites |
Reprinted from Developmental Biology, 393(1), Schupp, M.O., Waas, M., Chun, C.Z., Ramchandran, R., Transcriptional inhibition of etv2 expression is essential for embryonic cardiac development, 71-83, Copyright (2014) with permission from Elsevier. Full text @ Dev. Biol.