
- Title
-
Transcriptional inhibition of etv2 expression is essential for embryonic cardiac development
- Authors
- Schupp, M.O., Waas, M., Chun, C.Z., Ramchandran, R.
- Source
- Full text @ Dev. Biol.

Overview on transgenic construct designs and expression patterns: (A) Constructs c1-c6 contained different fragments of the etv2 locus on chromosome 16 ranging from inclusion of the whole non-coding 4164 bp etv2-fli1b intergenic region (blue) plus the first and second exon-intron pair (purple) downstream of the transcription start site (TSS) fused to cDNA of fluorescent reporter protein mCherry in c1, a shorter 2170 bp upstream fragment plus the downstream region fused to egfp cDNA in c2, and a 2170 bp upstream fragment without the downstream exon-intron pair fused to kaede coding sequence in c3. Construct c4 contained a 100 bp more upstream sequence than c2 including the FOXC binding site (black asterisks) described by Veldman and Lin (2012), and c5 and c6 contained 3108 bp and 602 bp upstream sequences, respectively. c4-c6 also included the downstream region (equivalent to c1 and c2), and was fused to the egfp reporter. All constructs c1-c6 contained a polyadenylation signal (pA) at the 3′ end. (B) Expression patterns of c1-c6 in stable transgenic embryos around 1 dpf (25 som to prim 8 stages) were revealed by ISH. Representative embryos are oriented laterally with the head to the left. All transgenes showed robust vascular expression in head and axial vessels and the vascular plexus region recapitulating the endogenous etv2 expression pattern except for c3, which showed vascular plexus expression but reduced axial and head vessel expression. (C) At 20-22 som, endogenous etv2 expression is present in the endocardial domain of the developing cardiac disc, which was recapitulated by the c2 egfp reporter (white arrows). In contrast, the c3 kaede reporter was expressed in the myocardial domain of the early heart (white dashed circle). Embryo views are dorsal with the head to the top. EXPRESSION / LABELING:
|
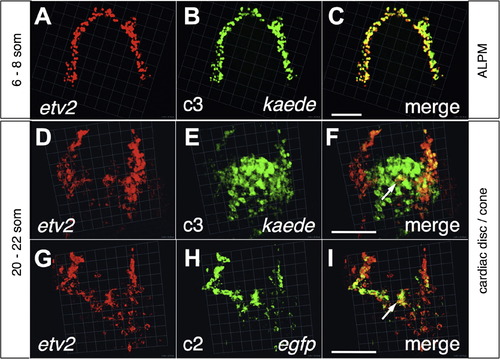
The c3 intron-less reporter recapitulates endogenous etv2 expression pattern during early but not late segmentation stages. Two-color fluorescent ISH of c3 transgenic embryos at 6-8 som in the ALPM (A-C) and at 20-22 som in the cardiac disc (D-F) for the detection of endogenous transcripts of etv2 in red (A and D) and concomitant detection of kaede transcripts from the c3 transgene in green (B and E), merged in (C and F). At 6-8 som, maximal overlap of both signals was observed (C), however at 20-22 som, cardiac c3 transgene expression did not overlap with endogenous etv2 (F) whereas the c2 egfp transgene recapitulated etv2 expression at that stage (G and H). Embryos are dorsal with anterior to the top. Images shown are snapshots from 3D views with bars ≈100 µm related to the background grid (1 unit=45.18 µm in A-C, 22.59 µm in D-F, and 22.54 µm in G-I). EXPRESSION / LABELING:
|
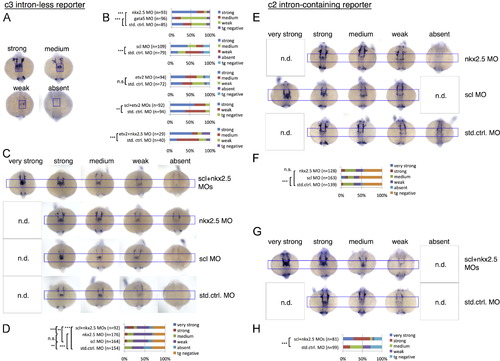
Changes in intron-less c3 transgene versus intron-containing c2 transgene expression magnitudes in the cardiac disc in response to single and combined knockdowns of key myocardial (gata5, nkx2.5) and endocardial/endothelial (scl, etv2) transcription factors. (A) Representative embryos post ISH showing four categories of c3 transgene expression magnitudes in the myocardial domain of the cardiac disc (blue frame) with transgene expression categories scored and quantified in (B1-5). Knockdown of nkx2.5 resulted in an increase, knockdown of gata5 in a decrease of c3 transgene expression (B1). Knockdown of scl also lead to an increase (B2), etv2 morphants however showed no significant change in c3 transgene expression (B3). Combined knockdown of scl and etv2 (B4) or nkx2.5 and etv2 (B5) again resulted in an increased c3 transgene expression indicating that scl and nkx2.5 (but not etv2) cooperate in c3 repression. (C-D) Combined knockdown of scl and nkx2.5 compared to single knockdowns showing cardiac disc expression categories of the c3 transgene in representative embryos (C) and quantification (D). Note that combined scl and nkx2.5 knockdown resulted in an additional category of “very strong” c3 transgene expressing embryos not seen in single knockdowns indicating synergism of scl and nkx2.5 in c3 transgene repression. (E) Representative embryos showing categories of c2 transgene expression in the endocardial domain of the cardiac disc following single knockdowns of scl and nkx2.5 and quantification in (F). (G) Combined knockdown of scl and nkx2.5 showing cardiac disc expression categories of the c2 transgene in representative embryos and quantification in (H). Note that single nkx2.5 knockdown resulted in significant change in c3 but not c2 transgene expression (compare D and F). Embryos shown are at 20-22 som stages in dorsal view with anterior to the top. *** indicates p≤0.001; ** indicates p≤0.01; * indicates p≤0.05; n.s.=not significant (p>0.05); n.d.=not detected; MO=morpholino; n=number of scored embryos; blue frame marks the endocardial cardiac disc expression domain of the c2 transgene. Categories of transgene expression magnitudes scored are color-coded in (B, D, F and H). Pooled F2 and F3 generations of two transgenic c3 lines were analyzed in A/B, and pooled F5 and F2 generations of 2 lines in C/D. F4 generation embryos of two c2 lines were analyzed in E-H. EXPRESSION / LABELING:
|

Spatial changes in intron-less c3 and intron-containing c2 transgene expression in scl/nkx2.5 morphant cardiac discs. Display of myl7+ myocardial progenitor cells (red) and concomitant display of cells expressing either c3 kaede+ (A-L) or c2 egfp+ (M-X) reporter transgenes (green) by two-color fluorescent in-situ-hybridization. Merged images are shown in (C, F, I, L) and (O, R, U, X), respectively, with insets showing transverse optical sections at the section plane indicated by dashed lines. In control embryos, the c3 transgene expression shows maximal overlap with the flat and disc-shape myocardial myl7+ expression domain (A-C, similar as in Fig. S2 M-O), but the c2 transgene expression marking the endocardial domain (dashed circle in N) shows minimal overlap (M-O). In scl morphants, the endocardial domains of both c3 (D-F) and c2 (P-R) transgenes were enlarged (indicated by arrow in F and dashed circle in Q), resulting in compaction of the myocardial domain around the enlarged endocardial domain (see insets). In nkx2.5 morphants, the size of the myocardial disc was reduced (compare G and S to A and M), however the myocardial c3 transgene expression domain (G-I) was increased (dashed circle in I). The size of the endocardial domain marked by the c2 transgene was unchanged in nkx2.5 morphant cardiac discs (S-U, dashed circle in T). In double scl/nkx2.5 knockdown embryos, cardiac expression of the intron-less c3 transgene was increased in both endocardial and myocardial domains (J-L), and intron-less c2 transgene expression showed an increase in the endocardial domain (V-X). Note myl7+ c2 transgene expressing cells in scl/nkx2.5 double morphants indicated by arrowhead in the transverse optical section in inset of X. Approximate myocardial domain sizes are given in A, M, G and S. Embryos are 20-22 som in dorsal views with anterior to the top from one c3 line (F5 generation) and one c2 line (F4). Images shown are snapshots from 3D views with bars ≈100 µm in relation to the background grid (1 unit=45.18 µm). Transverse optical sections (insets) were scaled down 0.6×. EXPRESSION / LABELING:
|

Response of endogenous etv2 expression to single and combined knockdowns of nkx2.5 and scl in the cardiac disc: (A) representative embryos showing categories of etv2 expression in the endocardial domain of the cardiac disc following single and combined knockdowns of scl and nkx2.5 and quantification in (B). Note that single nkx2.5 morpholino knockdown resulted in no significant modulation of etv2 expression but further increased the effect of scl morpholino in double knockdown experiments. Embryos shown are at 20-22 som stages in dorsal view with anterior to the top. *** indicates p≤0.001; ** indicates pd0.01; * indicates p≤0.05, n.s.=not significant (p>0.05); n.d.=not detected; MO=morpholino; n=number of scored embryos; blue frame marks the endocardial cardiac disc expression domain of etv2. Categories of transgene expression magnitudes scored are color-coded in (B). EXPRESSION / LABELING:
|
Reprinted from Developmental Biology, 393(1), Schupp, M.O., Waas, M., Chun, C.Z., Ramchandran, R., Transcriptional inhibition of etv2 expression is essential for embryonic cardiac development, 71-83, Copyright (2014) with permission from Elsevier. Full text @ Dev. Biol.