
Fig. S7
- ID
- ZDB-FIG-150129-24
- Publication
- Zhao et al., 2014 - Leptin and IL-6 Family Cytokines Synergize to Stimulate Müller Glia Reprogramming and Retina Regeneration
- Other Figures
- All Figure Page
- Back to All Figure Page
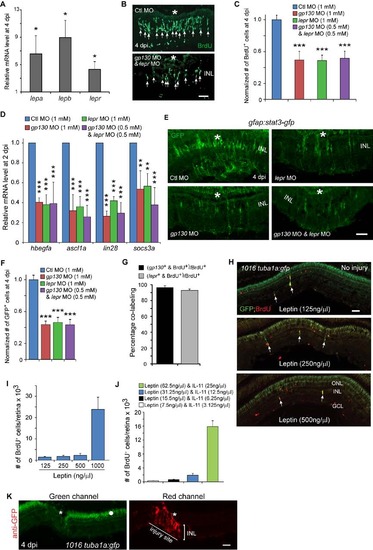
Leptin signaling regulates the generation of MG-derived progenitors. Related to Figure 5. (A) qPCR quantification of injury-dependent gene induction in FACS purified GFP+ MG-derived progenitors from the retina of 1016tuba1a:gfp fish at 4 dpi in comparison to that in FACS purified GFP+ MG from the uninjured retina of gfap:gfp fish; *P<0.05, n=3. (B) BrdU immunofluorescence shows that Leptin receptor and Gp130 knockdown inhibits the generation of BrdU+ MG-derived progenitors at 4 dpi. Asterisks mark the injury sites and the arrows point to MG-derived progenitors. (C) Quantification of the effects Gp130 and Leptin receptor knockdown have on progenitor formation (Figure 4C; Figure 5C); ***P<0.001, n=4. (D) qPCR showing Gp130 and Leptin receptor knockdown, individually or in combination, inhibits injury-dependent induction of reprogramming genes at 2 dpi; **P<0.01, ***P<0.001, n=4. (E) Knockdown of Gp130 inhibits the expression of Stat3-GFP at 4 dpi. (F) Quantification of the number of GFP+ cells in the retina at 4 dpi following Gp130 or Leptin knockdown; ***P<0.001, n=4. Error bars, s.d. (G) Quantification of the number of BrdU+ cells expressing gp130 or lepr RNA in the retina at 4 dpi; n=3. Error bars, s.d. (H) Effects of different Leptin concentrations on the generation of BrdU+ MG-derived progenitors and transgene expression in the uninjured retina of 1016tuba1a:gfp fish. The arrows point to MG-derived progenitors. (I, J) Quantification of the effect different Leptin (I) or Leptin/IL-11 (J) concentrations have on progenitor formation in the uninjured retina; n=3. Error bars, s.d. (K) GFP immunofluorescence using a secondary antibody coupled to a red fluor shows autofluorescence in the green channel (left-hand panel, dot) that is localized to the ONL and pigment epithelium, while the red channel shows GFP expression restricted to the injury site (right-hand panel, asterisk). Scale bars, 20 µm (B); 50 µm (E, H, K). ONL, outer nuclear layer; INL, inner nuclear layer; GCL, ganglion cell layer. |