
Fig. 3
- ID
- ZDB-FIG-150115-31
- Publication
- Fukuhara et al., 2014 - Visualizing the cell-cycle progression of endothelial cells in zebrafish
- Other Figures
- All Figure Page
- Back to All Figure Page
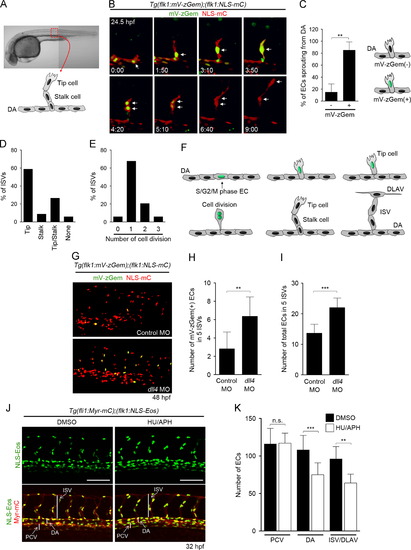
Cell-cycle progression of ECs during ISV formation. (A, B) Time-lapse confocal imaging of ISV sprouting from the dorsal aorta (DA) in the trunk region of a Tg(flk1:mV-zGem);(flk1:NLS-mC) fish embryo. (A) ISVs used for imaging analyses. An ISV of the boxed region is presented schematically. (B) 3D-rendered confocal 3D image of the embryo at 24.5 hpf (left upper) and its subsequent time-lapse images at the elapsed time (hr:min) indicated at the bottom (mVenus [green] and mCherry [red]). Note that an EC in the S/G2/M phase sprouts from the DA (arrows in 0:00 and 1:50), divides during dorsal migration (arrows in 3:10, 3:50, 4:20), leaves the M-phase (arrows in 5:10 and 6:40), and further migrates dorsally (arrow in 9:00) to form an ISV. (C) Percentages of mV-zGem-negative () and mV-zGem-positive (+) ECs involved only in forming ISV by sprouting from the DA. Data are shown as means±s.d. (n=5). (D) Types of ECs that divide during ISV formation. Cell division was defined by the division of mV-zGem-positive ECs. The numbers of ISVs showing tip cell division (Tip), stalk cell division (Stalk) or division of both tip and stalk cells (Tip/Stalk) or showing no cell division (None) were divided by the total number of ISVs observed (n=34). (E) Quantification of the number of EC divisions during ISV formation. The numbers of ISVs showing no cell division, one, two, or three rounds of cell division divided by the total numbers of ISVs observed (n=34). (F) A model of cell-cycle regulation of ECs during ISV formation. (G) 3D-rendered confocal 3D images of the trunk regions of Tg(flk1:mV-zGem);(flk1:NLS-mC) embryos injected with control MO (upper panel) or dll4 MO (lower panel) at 48 hpf. Upper, merged images (mVenus [green] and mCherry [red]) of control morphants; lower, those of dll4 morphants. (H, I) The number of mV-zGem-positive cells (H) and the total number of ECs (I) within the five ISVs. Data are shown as means±s.d. (n=11). (J) 3D-rendered confocal images of the trunk regions of 32 hpf Tg(fli1:Myr-mC);( flk1:NLS-Eos) embryos treated from 20 hpf with DMSO (left column) or HU/APH (right column). Upper, Eos images; lower, the merged images of Eos and mCherry. Scale bars, 100 μm. (K) The numbers of ECs in the posterior cardinal vein (PCV), DA and ISV/dorsal longitudinal anastomotic vessel (DLAV) within the five ISVs as observed in J were counted, and shown as means±s.d. (DMSO [n=9], HU/APH [n=11]). ISV, intersegmental vessel; DA, dorsal aorta; DLAV, dorsal longitudinal anastomotic vessels. NNp<0.01, NNNp<0.001 (C, H, I, K). n.s., no significance. |
| Genes: | |
|---|---|
| Fish: | |
| Condition: | |
| Knockdown Reagent: | |
| Anatomical Terms: | |
| Stage Range: | Prim-5 to Long-pec |
| Fish: | |
|---|---|
| Condition: | |
| Knockdown Reagent: | |
| Observed In: | |
| Stage Range: | Prim-15 to Long-pec |
Reprinted from Developmental Biology, 393(1), Fukuhara, S., Zhang, J., Yuge, S., Ando, K., Wakayama, Y., Sakaue-Sawano, A., Miyawaki, A., Mochizuki, N., Visualizing the cell-cycle progression of endothelial cells in zebrafish, 10-23, Copyright (2014) with permission from Elsevier. Full text @ Dev. Biol.