
Fig. 7
- ID
- ZDB-FIG-150115-35
- Publication
- Fukuhara et al., 2014 - Visualizing the cell-cycle progression of endothelial cells in zebrafish
- Other Figures
- All Figure Page
- Back to All Figure Page
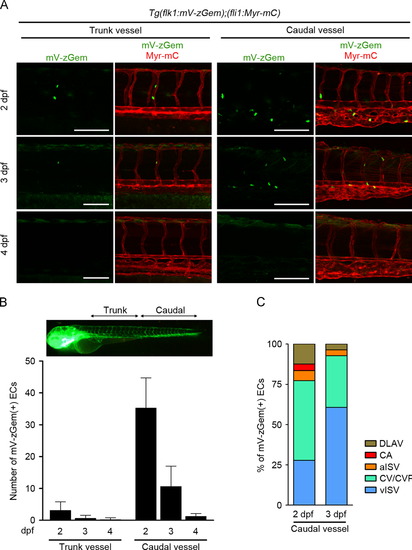
Cell-cycle progression of ECs during the late stage of vascular development. (A) 3D-rendered confocal images of the trunk (left) and caudal (right) vasculature in the Tg(flk1:mV-zGem);(fli1:Myr-mC) embryos at 2, 3 and 4 dpf as indicated at the left. Left, mVenus image; right, the merged image of mVenus (green) and mCherry (red). Scale bars, 100 μm. (B) The numbers of mVenus-positive ECs in the trunk and caudal vasculature at 2, 3 and 4 dpf, as observed in A, were counted and shown as means±s.d. (2 dpf [n=16], 3 dpf [n=14], 4 dpf [n=13]). (C) The numbers of mVenus-positive ECs in the DLAV, CA, arterial ISV (aISV), CV/CVP and venous ISV (vISV) of the caudal vasculature at 2 and 3 dpf were quantified, and then expressed as percentages of the total number (2 dpf [n=97], 3 dpf [n=28]). |
| Genes: | |
|---|---|
| Fish: | |
| Anatomical Terms: | |
| Stage Range: | Long-pec to Day 4 |
Reprinted from Developmental Biology, 393(1), Fukuhara, S., Zhang, J., Yuge, S., Ando, K., Wakayama, Y., Sakaue-Sawano, A., Miyawaki, A., Mochizuki, N., Visualizing the cell-cycle progression of endothelial cells in zebrafish, 10-23, Copyright (2014) with permission from Elsevier. Full text @ Dev. Biol.