
Fig. 3
- ID
- ZDB-FIG-141006-16
- Publication
- Moshal et al., 2011 - Discriminating Different Cancer Cells Using a Zebrafish in Vivo Assay
- Other Figures
- All Figure Page
- Back to All Figure Page
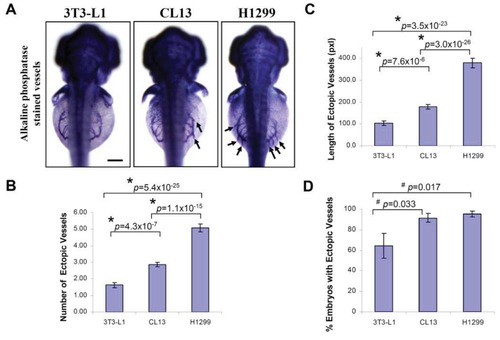
Quantification of angiogenic activity using zebrafish in vivo assay. Cells were injected into zebrafish embryos in order to evaluate the ability of zebrafish/tumor xenograft to quantify their angiogenic potentials. (A) Shown are representative light microscopy images of zebrafish embryos (dorsal view) at 3 dpf subjected to whole-mount alkaline phosphatase staining, 2 days after implantation with 3T3-L1 control, CL13 and H1299 cancer cells, and used to measure the number (B) and the length (C) of newly formed ectopic vessels and the percentage of embryos (D) with ectopic vessels, showing that H1299 and CL13 cancer cells induced differential neovascular response in the zebrafish embryos as compared to the 3T3-L1 control. The error bars represent ± SEM from three independent experiments. p values were determined by the Student′s t-test. Both * (p < 0.01) and # (p < 0.05) indicate statistically significant differences. n represents the number of embryos per group, 3T3-L1 (n = 140); CL13 (n = 198); H1299 (n = 176). Pixel (pxl) corresponds to 0.82 μm. Scale bar = 100 μm. |