
FIGURE
Fig. 1
- ID
- ZDB-FIG-141006-14
- Publication
- Moshal et al., 2011 - Discriminating Different Cancer Cells Using a Zebrafish in Vivo Assay
- Other Figures
- All Figure Page
- Back to All Figure Page
Fig. 1
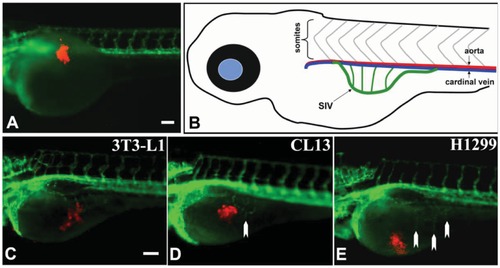
Tumor angiogenesis in transgenic Tg(flk1:GFP) zebrafish embryos. Lateral view of a fluorescent transgenic Tg(flk1:GFP) zebrafish embryo at 1 dpf that was just transplanted with cancer cells labeled with red fluorescent dye (A); (B) shows a sketch depicting the SIV (in green) of a 3 day old zebrafish embryo; Lateral views of transgenic Tg(flk1:GFP) zebrafish embryos at 3 dpf transplanted with 3T3-L1 cells (negative control) (C), CL13 (D) and H1299 (E) cancer cells; White arrows (D, E) indicate newly formed ectopic vessels from the SIV. Scale bars = 100 μm. |
Expression Data
Expression Detail
Antibody Labeling
Phenotype Data
Phenotype Detail
Acknowledgments
This image is the copyrighted work of the attributed author or publisher, and
ZFIN has permission only to display this image to its users.
Additional permissions should be obtained from the applicable author or publisher of the image.
Full text @ Cancers