
Fig. 2
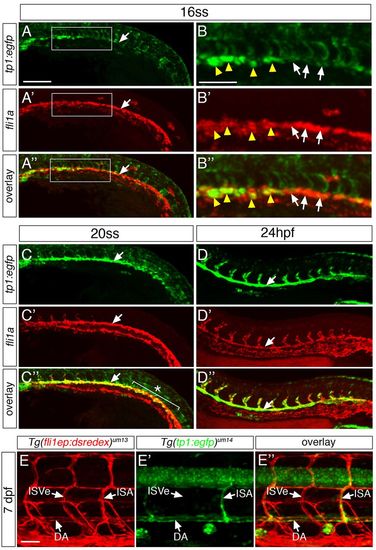
Notch activity increases and persists in arterial endothelial cells at later developmental stages. (A-D) Confocal micrographs of Tg(tp1:egfp)um14 embryos following fluorescence in situ hybridization using riboprobes against egfp (green) and fli1a (red). Lateral views, dorsal is up, anterior to the left. (A,C,D) White arrows denote dorsal aorta. (A) 16 ss embryo; the white box indicates the magnified area shown in B. (B) Yellow arrowheads and white arrows denote endothelial cells with high and low egfp expression, respectively. (C) Embryo at the 20 ss; the bracket with an asterisk in C2 shows area of mixed high- and low-expressing egfp-positive endothelial cells. (D) Embryo at 24 hpf. (E) Confocal micrograph of live Tg(fli1a:dsredex)um13;(tp1:egfp)um14 embryo at 7 days postfertilization showing Notch activation (green) and endothelial cells (red); DA, dorsal aorta; ISA, intersomitic artery; ISVe, intersomitic vein. Scale bars: 100 μm (A,C,D); 50 μm (B,E). |
| Genes: | |
|---|---|
| Fish: | |
| Anatomical Terms: | |
| Stage Range: | 14-19 somites to Days 7-13 |