
Fig. 1
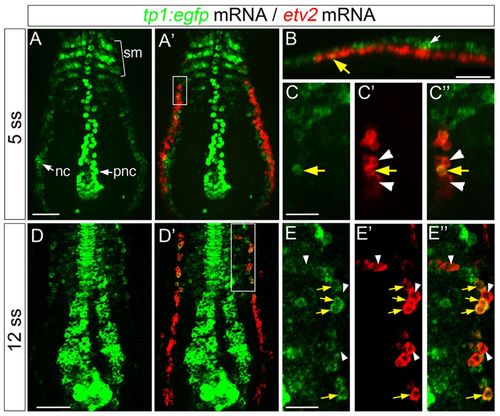
Notch signaling is active in early endothelial progenitors. (A-E) Confocal micrographs of flat-mounted Tg(tp1:egfp)um14 embryos following fluorescence in situ hybridization using riboprobes against egfp (green) and etv2 (red). (A,C-E) Dorsal views. (A-C) Images from the same embryo at 5 ss. (A,D) tp1:egfp expression; (A2,D2) tp1:egfp plus etv2 expression. (A) Arrows indicate neural crest (nc), proneural clusters (pnc); bracket denotes somitic mesoderm (sm). (B) Lateral view of embryo in A showing egfp expression in neural crest (white arrow), dorsal to etv2-expressing cells. The yellow arrow denotes the egfp/etv2-positive cell shown in C-C2 white arrowheads indicate the etv2-positive/egfp-negative cells. (C) Magnified area indicated by box in A2. (D,E) Images of the same embryo at 12 ss. (D2) Box indicates area magnified in E. (E) White arrowheads indicate etv2-positive/egfp-negative cells; yellow arrows denote egfp/etv2-coexpression. Scale bars: 100 μm (A,B,D); 40 μm (C,E). |
| Genes: | |
|---|---|
| Fish: | |
| Anatomical Terms: | |
| Stage Range: | 5-9 somites to 10-13 somites |