
FIGURE
Fig. 3
- ID
- ZDB-FIG-140328-18
- Publication
- Lister et al., 2014 - A Conditional Zebrafish MITF Mutation Reveals MITF Levels Are Critical for Melanoma Promotion vs. Regression In Vivo
- Other Figures
- All Figure Page
- Back to All Figure Page
Fig. 3
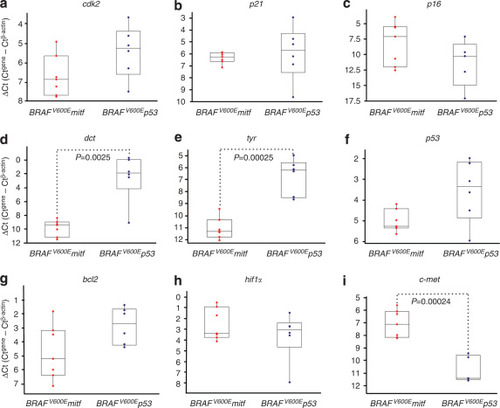
MITF target gene expression. (a–i) Box plots of quantitative real-time PCR (qRT-PCR) of MITF target genes and p53. The y-axis indicates the difference between the cycle threshold (Ct) value of the gene of interest and the Ct value of β-actin in each sample. Note that the y-axis is inverted for ease of interpretation. Bars represent interquartile range; P-values determined by Student’s t-test. Also see Supplementary Table S1 online. MITF, microphtholmia associated transcription factor. |
Expression Data
| Genes: | |
|---|---|
| Fish: | |
| Condition: | |
| Anatomical Term: | |
| Stage: | Adult |
Expression Detail
Antibody Labeling
Phenotype Data
| Fish: | |
|---|---|
| Condition: | |
| Observed In: | |
| Stage: | Adult |
Phenotype Detail
Acknowledgments
This image is the copyrighted work of the attributed author or publisher, and
ZFIN has permission only to display this image to its users.
Additional permissions should be obtained from the applicable author or publisher of the image.
Full text @ J. Invest. Dermatol.