
Fig. 2
- ID
- ZDB-FIG-140328-17
- Publication
- Lister et al., 2014 - A Conditional Zebrafish MITF Mutation Reveals MITF Levels Are Critical for Melanoma Promotion vs. Regression In Vivo
- Other Figures
- All Figure Page
- Back to All Figure Page
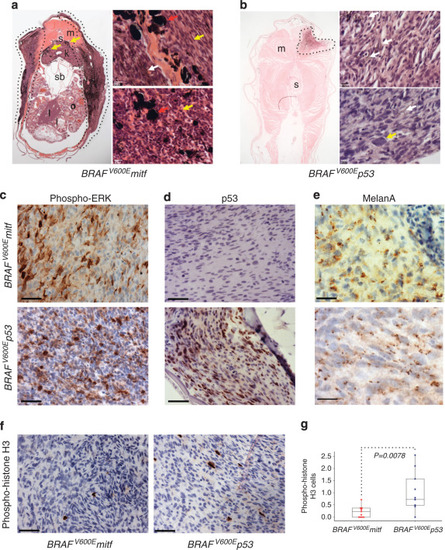
Comparative histopathology of BRAFV600E melanomas. (a) Cross-section of adult BRAFV600Emitf zebrafish with superficial spreading melanoma (dotted line). Infiltrating melanophages in the kidney are indicated (yellow arrows). i, intestine; k, kidney; l, liver; m, muscle; o, ovary; s, spinal column; sb, swimbladder. (Top and bottom panels) Hematoxylin and eosin (H&E) stain of BRAFV600Emitf melanoma, indicating large melanophages (red arrows), spindle or epithelioid cell shapes (yellow arrows), and pigmented melanoma cells (white arrow). Scale bars=20 μm. (b) Cross-section of adult BRAFV600Ep53 zebrafish with invasive melanoma (dotted line). (Top and bottom panels) H&E stain of BRAFV600Ep53 melanoma, indicating pigmented melanoma cells (white arrows) and nuclear pleomorphisms (yellow arrow). Scale bars=20 μm. (c–f) Immunohistochemistry staining for (c) phospho-extracellular signal–regulated kinase (ERK), (d) p53, (e) Melan-A, and (f) phospho-histone H3. Scale bars=50 μm. (g). Box plot of mean percentage phospho-histone H3–stained cells in BRAFV600Emitf and BRAFV600Ep53 tumors (n=11 melanomas of each genotype). Bars represent interquartile range; Student’s t-test P=0.0078. |
| Fish: | |
|---|---|
| Observed In: | |
| Stage: | Adult |