
Fig. 3
- ID
- ZDB-FIG-140305-78
- Publication
- Serbedzija et al., 1998 - Regulation in the heart field of zebrafish
- Other Figures
- All Figure Page
- Back to All Figure Page
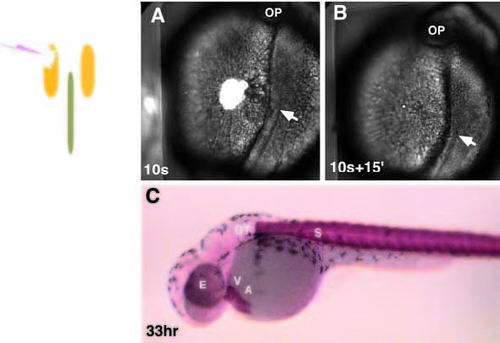
Phase and fluorescence images of cell ablation in the lateral plate mesoderm. The schematic images indicate the location of the ablation in relation to the notochord (brown) and Nkx2.5 expression (yellow). (A) Immediately following the ablation of the heart progenitors, the surrounding cells contract in a pursestring- like fashion and the dead cells, fluorescently labeled with Topro-1, are extruded from the embryo. (B) Within 15 minutes, the dead cells pinch off of the embryo. (C) Staining of the embryo at 33 hours with the anti-myosin heavy chain antibody, MF20, shows that both the heart and the embryo develop normally after the ablation. The MF20 antibody labels both the heart and the somites (S). For orientation, the optic cup (OP), eye (E), otic vesicle (OT), ventricle (V) and atrium (A) are labeled. |