
- Title
-
Regulation in the heart field of zebrafish
- Authors
- Serbedzija, G.N., Chen, J.-N., and Fishman, M.C.
- Source
- Full text @ Development
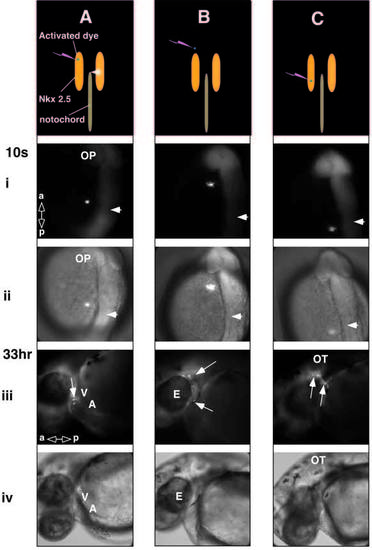
Fluorescence (A-C, row i and iii) and phase (A-C, row ii and iv) images of cell labeling in the lateral plate mesoderm. The schematic images indicate the location of the dye activation (blue dot) in relation to the notochord (brown line) and Nkx2.5 expression (yellow). The arrowhead is the notochord tip in all figures. (Ai-iv) Cells labeled in the lateral plate mesoderm just anterior to the prechordal plate-notochord junction at 10-somite stage, give rise to progeny in the heart (arrow) of the 33 hour embryo. (Bi-iv) More anterior cells give rise to cells in the cranial mesenchyme around the eye (arrows). (Ci-iv) More posterior cells contribute labeled cells (arrow) to the mesenchyme adjacent to the otic vesicle. For orientation, the optic cup (OP), eye (E), otic vesicle (OT), ventricle (V) and atrium (A) are labeled. |
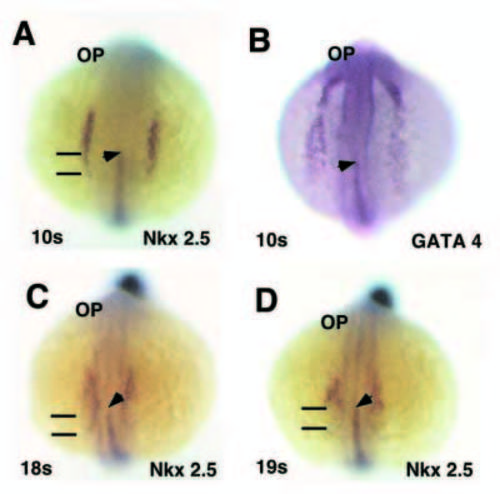
Nkx2.5 and GATA 4 staining. In all of the images, the notochord is stained with the no tail and the tip of the notochord is indicated by the arrowhead. (A) At the 10-somite stage, Nkx2.5 is expressed in the lateral plate straddling the prechordal plate-notochord junction. (B) GATA 4 is expressed in the same mediolateral level, but extends to the optic cup (OP). (C) At the 18-somite stage, the bilateral Nkx2.5- expressing cells converge at the midline at the tip of the notochord, in an X-shape pattern. (D) In the 19-somitestage embryos, Nkx2.5 is extinguished in the cells posterior to the notochord tip. In all of the Nkx2.5 stained images, the bars demarcate the original posterior Nkx2.5-expressing region. EXPRESSION / LABELING:
|
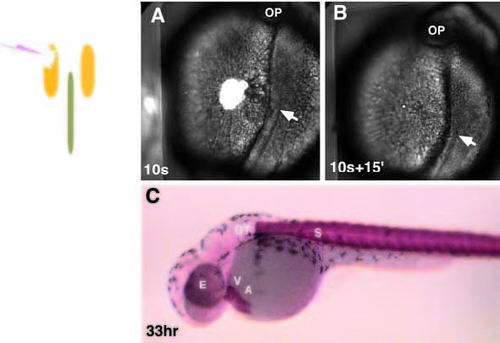
Phase and fluorescence images of cell ablation in the lateral plate mesoderm. The schematic images indicate the location of the ablation in relation to the notochord (brown) and Nkx2.5 expression (yellow). (A) Immediately following the ablation of the heart progenitors, the surrounding cells contract in a pursestring- like fashion and the dead cells, fluorescently labeled with Topro-1, are extruded from the embryo. (B) Within 15 minutes, the dead cells pinch off of the embryo. (C) Staining of the embryo at 33 hours with the anti-myosin heavy chain antibody, MF20, shows that both the heart and the embryo develop normally after the ablation. The MF20 antibody labels both the heart and the somites (S). For orientation, the optic cup (OP), eye (E), otic vesicle (OT), ventricle (V) and atrium (A) are labeled. |
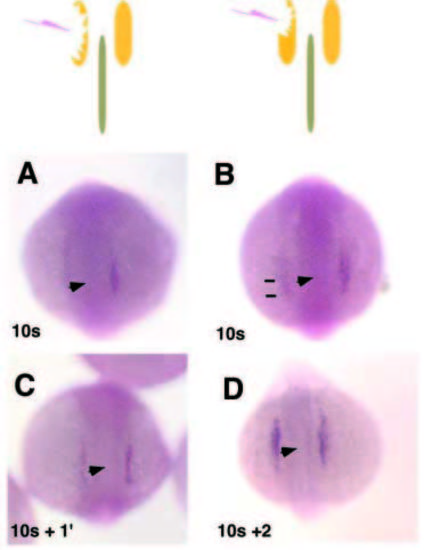
Recovery of Nkx2.5 staining after cell ablation. The schematic images indicate the location of the ablation in relation to the notochord and Nkx2.5 expression. Immediately after unilateral cell ablation in the 10-somite embryo of either (A) all of the Nkx2.5- expressing cells or (B) all of the heart progenitors; remaining posterior Nkx2.5 (marked by bars); there is no Nkx2.5 expression in the ablated region. (C) 1 hour after the ablation, the Nkx pattern of expression reappears, although the level of expression is lower than on the unablated side. (D) By 2 hours after the ablation, Nkx2.5 expression is normal. |
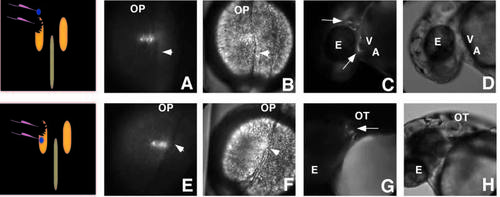
Cells that replace cardiac progenitors arise anterior to the position of normal cardiac progenitors. Fluorescent (A,C,E,D) and phase (B,D,F,G) images of cell labeling (blue dot) after ablation in 10-somite-stage embryos. The schematic images indicate the location of the ablation and cell labeling in relation to the notochord and Nkx2.5 expression. (A,B) Labeled fluorescent cells anterior to the ablation of the heart precursors give rise to cells in both the cranial mesenchyme and the heart (arrows; C,D). The purse-string-like contraction of the tissue surrounding the ablation have caused the labeled cells to elongate. (E,F) In contrast, labeled cells posterior to the ablation contribute to the mesenchyme around the otic vesicle but not the heart (arrow; G,H). For orientation, the optic cup (OP), eye (E), otic vesicle (OT), ventricle (V) and atrium (A) are labeled. Images are labeled as described in Fig. 1. |