
Fig. 1
- ID
- ZDB-FIG-140305-76
- Publication
- Serbedzija et al., 1998 - Regulation in the heart field of zebrafish
- Other Figures
- All Figure Page
- Back to All Figure Page
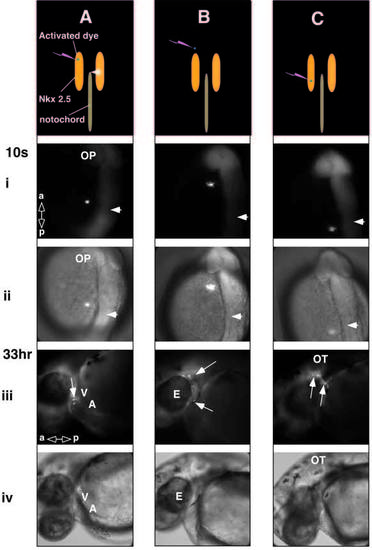
Fluorescence (A-C, row i and iii) and phase (A-C, row ii and iv) images of cell labeling in the lateral plate mesoderm. The schematic images indicate the location of the dye activation (blue dot) in relation to the notochord (brown line) and Nkx2.5 expression (yellow). The arrowhead is the notochord tip in all figures. (Ai-iv) Cells labeled in the lateral plate mesoderm just anterior to the prechordal plate-notochord junction at 10-somite stage, give rise to progeny in the heart (arrow) of the 33 hour embryo. (Bi-iv) More anterior cells give rise to cells in the cranial mesenchyme around the eye (arrows). (Ci-iv) More posterior cells contribute labeled cells (arrow) to the mesenchyme adjacent to the otic vesicle. For orientation, the optic cup (OP), eye (E), otic vesicle (OT), ventricle (V) and atrium (A) are labeled. |