
Fig. 6
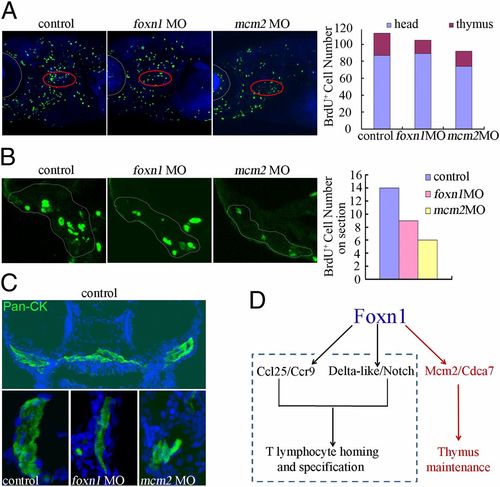
TEC proliferation defects in foxn1 and mcm2 morphants by BrdU labeling. (A) Reduced anti–BrdU-positive cells in foxn1- and mcm2 morphants by BrdU labeling on whole mount. Anti-BrdU positive cells were quantified in the thymus and the head region without the thymus of controls (n = 15), foxn1 morphants (n = 23), and mcm2 morphants (n = 19). Green, anti–BrdU-positive cells; blue, DAPI staining. Circles indicate thymus. (B) Reduced anti–BrdU-positive cells in control, foxn1 morphants, and mcm2 morphants by BrdU labeling on thymus sections. Dotted lines indicate the thymus area. Section thickness, 10 µm. The average number of anti–BrdU-positive cells per section was quantified. (C) Immunofluorescence on thymus sections with anti–Pan-CK staining, which clearly showed reduced number of TECs and smaller size of thymus in foxn1 and mcm2 morphants, compared with controls. Green, Pan-CK staining; blue, DAPI staining. (D) A proposed model of foxn1 functions in thymus development. Dashed square, published data; red arrows, this work. |
| Fish: | |
|---|---|
| Knockdown Reagents: | |
| Observed In: | |
| Stage: | Day 4 |