
Fig. S7
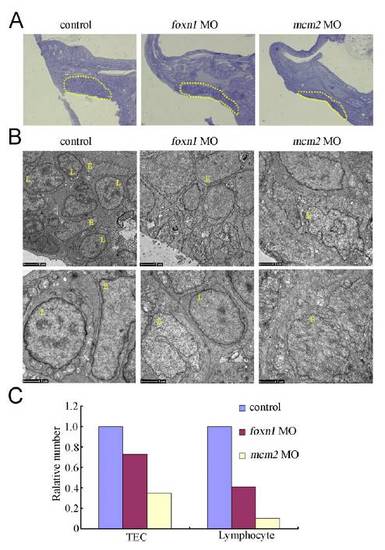
The structure of the thymus in control, foxn1 morphants, and mcm2 morphants. (A) The histology of the thymus in control, foxn1 morphants, and mcm2 morphants at 4 dpf using toluidine blue staining on semithin sections. The yellow dotted circles mark the thymus. (B) The ultrastructure of the thymus in control, foxn1 morphants, and mcm2 morphants at 4 dpf using transmission electron microscopy. T lymphocytes were round-shape and the nucleus staining was dense, whereas TECs were less stained and were reticular-shape in controls but irregular in morphants. L stands for the lymphocytes and E stands for the TEC. (Scale bars: Upper, 2 μm; Lower, 1 μm.) (C) The number of TEC and lymphocytes in control, foxn1 morphants and mcm2 morphants at 4 dpf on semithin section of the thymus. The ratio of numbers of TECs or T cells in individual morphant versus control thymus sections are shown as a percentage. |