
FIGURE
Fig. S3
Fig. S3
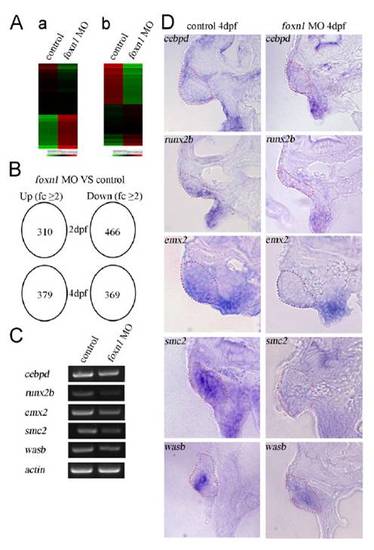
Expression profiling and verification of microarray results using semiquantitative RT-PCR and WISH. (A) Heatmap analysis for microarray data at 2 dpf (a) and 4 dpf (b). (B) Overview of the microarray data. (C) Verification of microarray results and a list of down-regulated genes from microarray data were chosen for further validation by semiquantitative RT-PCR (C) and transverse sectioning after WISH (D). Dashed lines mark the thymus region. |
Expression Data
Expression Detail
Antibody Labeling
Phenotype Data
Phenotype Detail
Acknowledgments
This image is the copyrighted work of the attributed author or publisher, and
ZFIN has permission only to display this image to its users.
Additional permissions should be obtained from the applicable author or publisher of the image.
Full text @ Proc. Natl. Acad. Sci. USA