
Fig. S3
- ID
- ZDB-FIG-131217-2
- Publication
- Hall et al., 2012 - Infection-Responsive Expansion of the Hematopoietic Stem and Progenitor Cell Compartment in Zebrafish Is Dependent upon Inducible Nitric Oxide
- Other Figures
- All Figure Page
- Back to All Figure Page
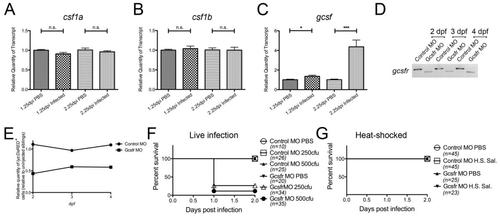
QPCR expression analysis of csf1a (A), csf1b (B) and gscf (C) at 1.25 and 2.25 dpi following infection, relative to PBS controls, means standard errors. (D) RT-PCR detection of disrupted gcsfr splicing at 2, 3 and 4 dpf following Gcsfr MO injection. (E) Effect of Gcsfr-depletion on steady-state granulopoiesis. Relative quantities of whole-larvae fluorescent cells, as determined by flow cytometry, within Tg(lyz:DsRED) larvae at 2, 3 and 4 dpf following injection of control and Gcsfr-targeting MOs, relative to uninjected siblings. (F and G) Gcsfr-depleted larvae demonstrate reduced survival to live, but not heat-killed, Salmonella. (F) Survival graph of control MO injected/PBS (n=10), control MO injected/250 cfu infected (n=26), control MO injected/500 cfu infected (n=25), Gcsfr MO injected/PBS (n=20), Gcsfr MO injected/250 cfu infected (n=34) and Gcsfr MO injected/500 cfu infected (n=35). (G) Survival graph of control MO injected/PBS (n=45), control MO injected/heat-shocked Salmonella (H.S. Sal.) injected (n=45), Gscfr MO injected/PBS (n=25) and Gcsfr MO injected/ H.S. Sal. injected (n=23). Abbreviations: n.s., not significant; *, p-value<0.05; ***, p-value<0.001. |
| Fish: | |
|---|---|
| Condition: | |
| Knockdown Reagent: | |
| Observed In: | |
| Stage Range: | 1-cell to Day 4 |