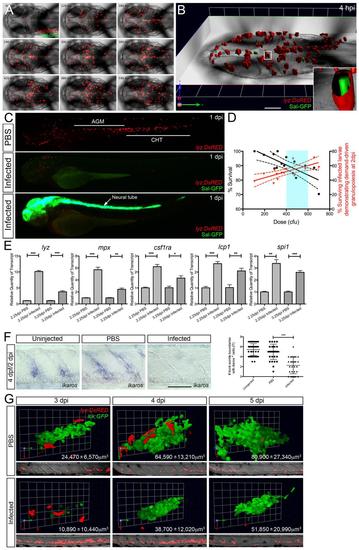
(A) Time-lapse confocal imaging of neutrophil response to 300 cfu Sal-GFP injected into the hindbrain ventricle of Tg(lyz:DsRED) embryos at 50 hpf. (B) 3D reconstruction of A at 4 hpi; inset, magnified view of boxed neutrophil with cutting plane to reveal phagocytosed Sal-GFP. (C) Tg(lyz:DsRED) larvae 1 day following injection of 600 cfu Sal-GFP demonstrating either diminished neutrophil numbers or extensive bacterial burden, compared to PBS control. (D) Survival and demand-driven granulopoiesis frequency relative to infection dose. Percent survival (in black) relative to hindbrain injection dose (cfu) and % of surviving infected larvae demonstrating demand-driven granulopoiesis (in red) relative to infection dose (solid lines represent mean with 95% confidence interval dashed) as scored at 2 dpi. Light blue box highlights infection dose range used in this study. (E) QPCR expression analysis of lyz, mpx, csf1ra, lcp1 and spi1 within infected larvae at 2.25 and 3.25 dpi, relative to PBS controls, means standard ± errors. (F and G) Infected larvae demonstrate reduced lymphopoiesis. (F) Expression and quantification of ikaros-expressing cells within the AGM of uninjected (4 dpf), PBS control and infected larvae at 2dpi. (G) Confocal imaging through the thymus of Tg(lyz:DsRED)/Tg(lck:GFP) infected larvae (compared with PBS controls). Volumes of lck:GFP-expressing cells within the thymus are represented as mean standard deviation. Thymus reconstructions are paired with images through the AGM region of same larvae. All views, anterior to left. *, p-value<0.05; **, p-value<0.01; ***, p-value<0.001. Scale bars, 50μm in B and F.
|
